Version 3.0.0
Note
Click here to download the full example code
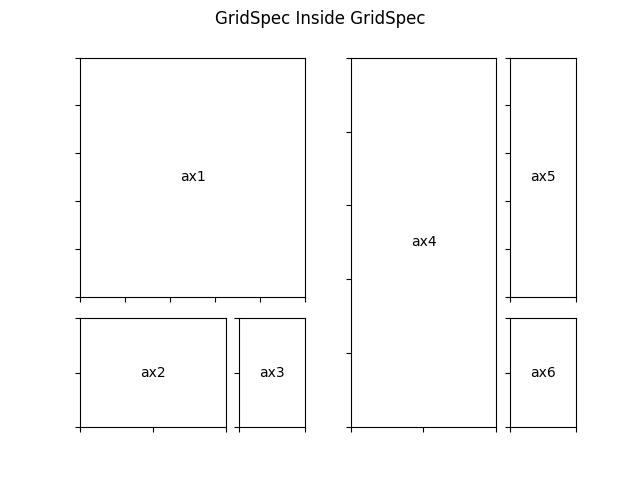
GridSpecs can be nested, so that a subplot from a parent GridSpec can set the position for a nested grid of subplots.
import matplotlib.pyplot as plt
import matplotlib.gridspec as gridspec


def format_axes(fig):
    for i, ax in enumerate(fig.axes):
        ax.text(0.5, 0.5, "ax%d" % (i+1), va="center", ha="center")
        ax.tick_params(labelbottom=False, labelleft=False)


# gridspec inside gridspec
f = plt.figure()

gs0 = gridspec.GridSpec(1, 2, figure=f)

gs00 = gridspec.GridSpecFromSubplotSpec(3, 3, subplot_spec=gs0[0])

ax1 = plt.Subplot(f, gs00[:-1, :])
f.add_subplot(ax1)
ax2 = plt.Subplot(f, gs00[-1, :-1])
f.add_subplot(ax2)
ax3 = plt.Subplot(f, gs00[-1, -1])
f.add_subplot(ax3)


gs01 = gridspec.GridSpecFromSubplotSpec(3, 3, subplot_spec=gs0[1])

ax4 = plt.Subplot(f, gs01[:, :-1])
f.add_subplot(ax4)
ax5 = plt.Subplot(f, gs01[:-1, -1])
f.add_subplot(ax5)
ax6 = plt.Subplot(f, gs01[-1, -1])
f.add_subplot(ax6)

plt.suptitle("GridSpec Inside GridSpec")
format_axes(f)

plt.show()
Keywords: matplotlib code example, codex, python plot, pyplot Gallery generated by Sphinx-Gallery