Version 3.0.0
Note
Click here to download the full example code
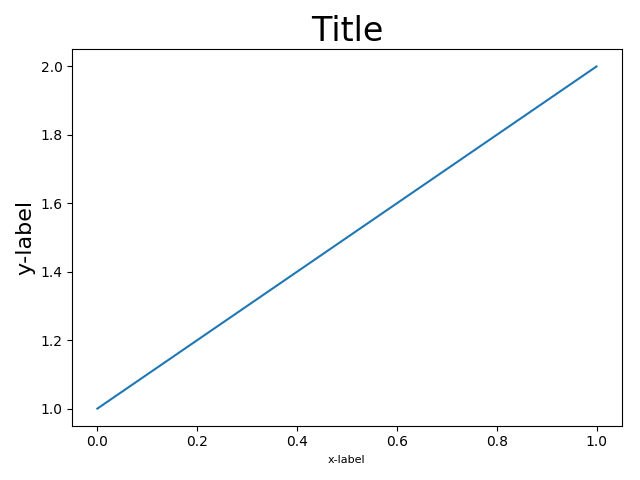
tight_layout attempts to resize subplots in
a figure so that there are no overlaps between axes objects and labels
on the axes.
See Tight Layout guide for more details and Constrained Layout Guide for an alternative.
import matplotlib.pyplot as plt
import itertools
import warnings


fontsizes = itertools.cycle([8, 16, 24, 32])


def example_plot(ax):
    ax.plot([1, 2])
    ax.set_xlabel('x-label', fontsize=next(fontsizes))
    ax.set_ylabel('y-label', fontsize=next(fontsizes))
    ax.set_title('Title', fontsize=next(fontsizes))
fig, ax = plt.subplots()
example_plot(ax)
plt.tight_layout()
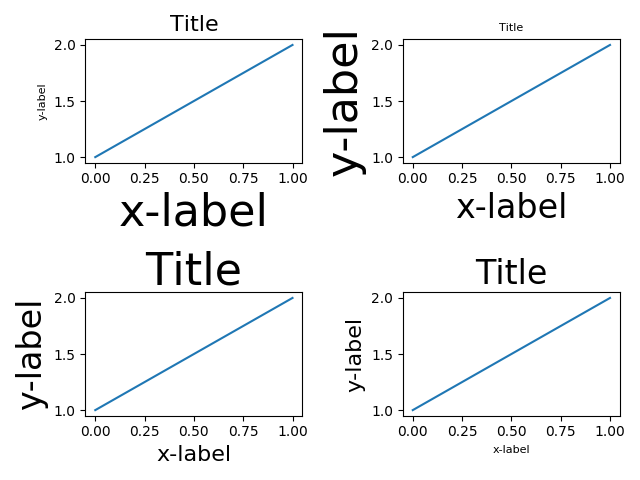
fig, ((ax1, ax2), (ax3, ax4)) = plt.subplots(nrows=2, ncols=2)
example_plot(ax1)
example_plot(ax2)
example_plot(ax3)
example_plot(ax4)
plt.tight_layout()
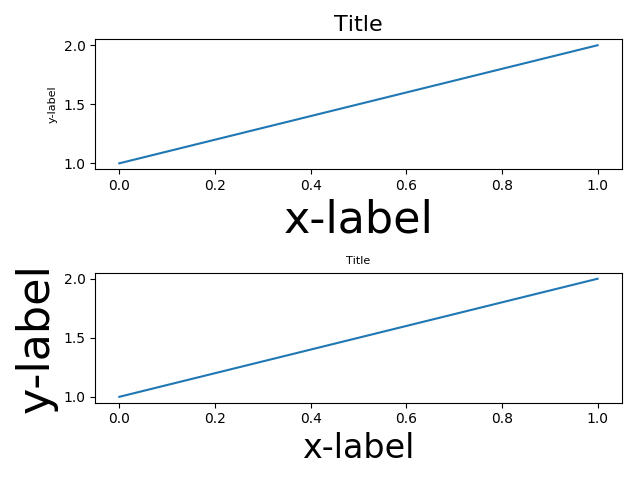
fig, (ax1, ax2) = plt.subplots(nrows=2, ncols=1)
example_plot(ax1)
example_plot(ax2)
plt.tight_layout()
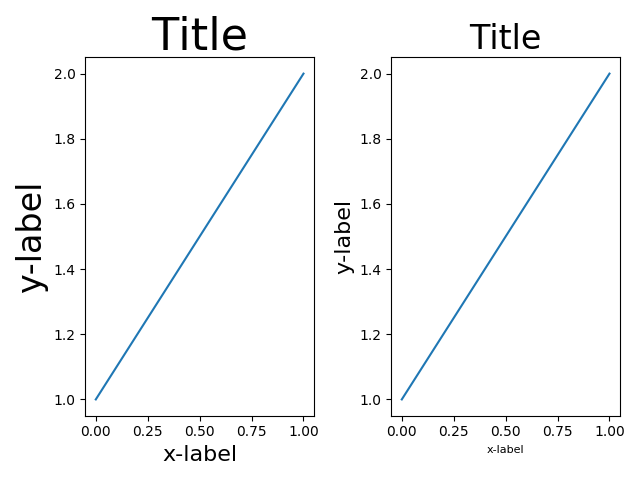
fig, (ax1, ax2) = plt.subplots(nrows=1, ncols=2)
example_plot(ax1)
example_plot(ax2)
plt.tight_layout()
fig, axes = plt.subplots(nrows=3, ncols=3)
for row in axes:
    for ax in row:
        example_plot(ax)
plt.tight_layout()
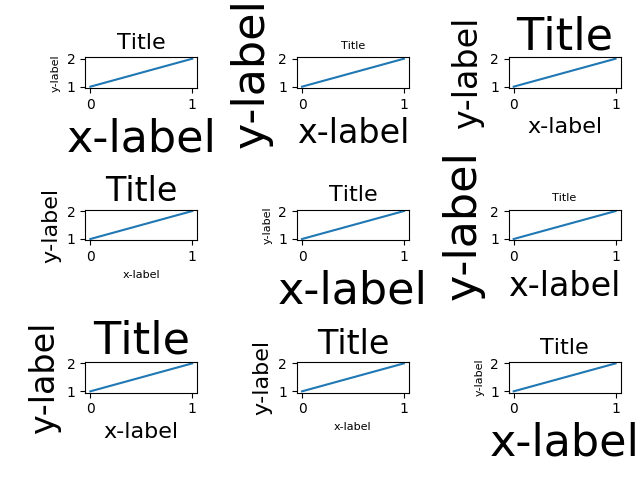
fig = plt.figure()

ax1 = plt.subplot(221)
ax2 = plt.subplot(223)
ax3 = plt.subplot(122)

example_plot(ax1)
example_plot(ax2)
example_plot(ax3)

plt.tight_layout()
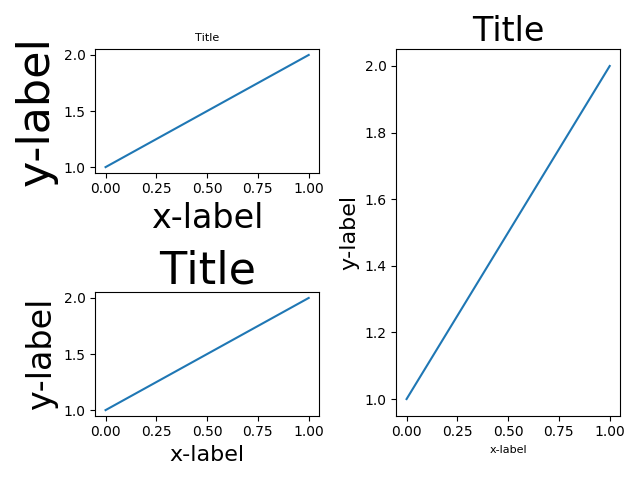
fig = plt.figure()

ax1 = plt.subplot2grid((3, 3), (0, 0))
ax2 = plt.subplot2grid((3, 3), (0, 1), colspan=2)
ax3 = plt.subplot2grid((3, 3), (1, 0), colspan=2, rowspan=2)
ax4 = plt.subplot2grid((3, 3), (1, 2), rowspan=2)

example_plot(ax1)
example_plot(ax2)
example_plot(ax3)
example_plot(ax4)

plt.tight_layout()

plt.show()
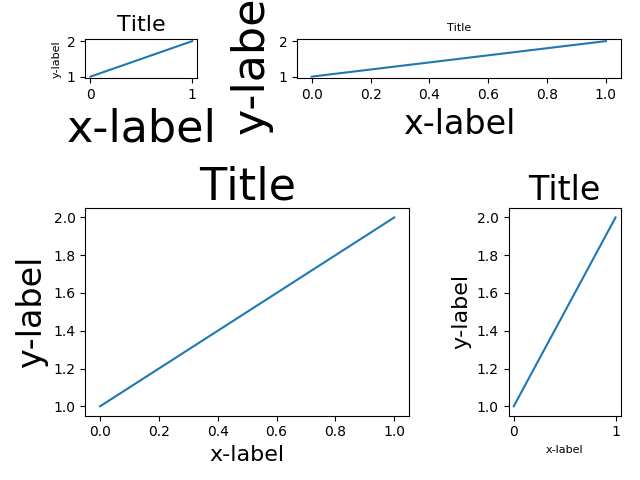
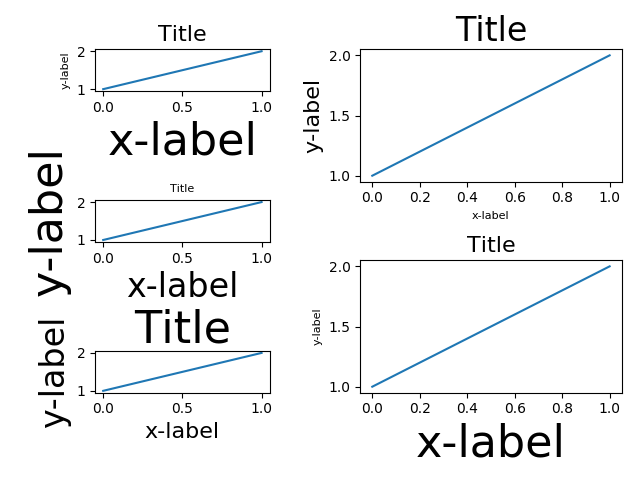
fig = plt.figure()

import matplotlib.gridspec as gridspec

gs1 = gridspec.GridSpec(3, 1)
ax1 = fig.add_subplot(gs1[0])
ax2 = fig.add_subplot(gs1[1])
ax3 = fig.add_subplot(gs1[2])

example_plot(ax1)
example_plot(ax2)
example_plot(ax3)

with warnings.catch_warnings():
    warnings.simplefilter("ignore", UserWarning)
    # This raises warnings since tight layout cannot
    # handle gridspec automatically. We are going to
    # do that manually so we can filter the warning.
    gs1.tight_layout(fig, rect=[None, None, 0.45, None])

gs2 = gridspec.GridSpec(2, 1)
ax4 = fig.add_subplot(gs2[0])
ax5 = fig.add_subplot(gs2[1])

example_plot(ax4)
example_plot(ax5)

with warnings.catch_warnings():
    # This raises warnings since tight layout cannot
    # handle gridspec automatically. We are going to
    # do that manually so we can filter the warning.
    warnings.simplefilter("ignore", UserWarning)
    gs2.tight_layout(fig, rect=[0.45, None, None, None])

# now match the top and bottom of two gridspecs.
top = min(gs1.top, gs2.top)
bottom = max(gs1.bottom, gs2.bottom)

gs1.update(top=top, bottom=bottom)
gs2.update(top=top, bottom=bottom)

plt.show()
The use of the following functions and methods is shown in this example:
Keywords: matplotlib code example, codex, python plot, pyplot Gallery generated by Sphinx-Gallery