Version 3.0.0
Note
Click here to download the full example code
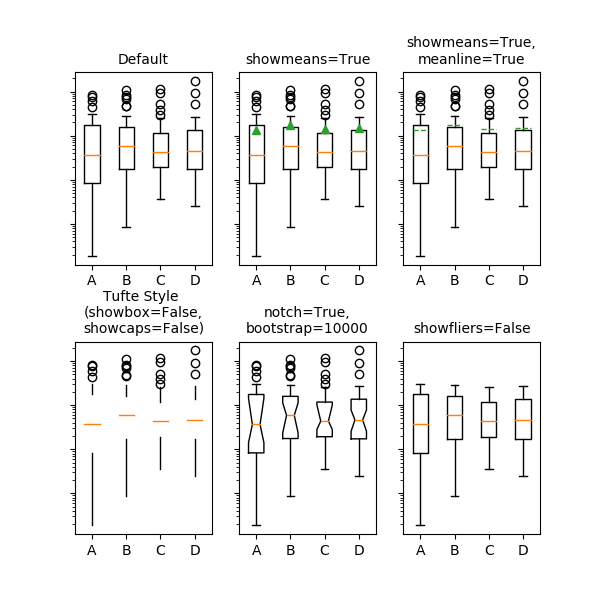
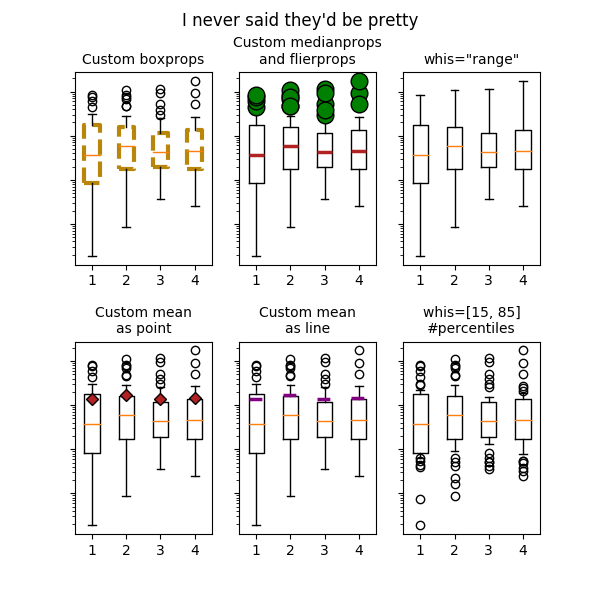
This example demonstrates how to use the various kwargs to fully customize box plots. The first figure demonstrates how to remove and add individual components (note that the mean is the only value not shown by default). The second figure demonstrates how the styles of the artists can be customized. It also demonstrates how to set the limit of the whiskers to specific percentiles (lower right axes)
A good general reference on boxplots and their history can be found here: http://vita.had.co.nz/papers/boxplots.pdf
import numpy as np
import matplotlib.pyplot as plt

# fake data
np.random.seed(19680801)
data = np.random.lognormal(size=(37, 4), mean=1.5, sigma=1.75)
labels = list('ABCD')
fs = 10  # fontsize
Demonstrate how to toggle the display of different elements:
fig, axes = plt.subplots(nrows=2, ncols=3, figsize=(6, 6), sharey=True)
axes[0, 0].boxplot(data, labels=labels)
axes[0, 0].set_title('Default', fontsize=fs)

axes[0, 1].boxplot(data, labels=labels, showmeans=True)
axes[0, 1].set_title('showmeans=True', fontsize=fs)

axes[0, 2].boxplot(data, labels=labels, showmeans=True, meanline=True)
axes[0, 2].set_title('showmeans=True,\nmeanline=True', fontsize=fs)

axes[1, 0].boxplot(data, labels=labels, showbox=False, showcaps=False)
tufte_title = 'Tufte Style \n(showbox=False,\nshowcaps=False)'
axes[1, 0].set_title(tufte_title, fontsize=fs)

axes[1, 1].boxplot(data, labels=labels, notch=True, bootstrap=10000)
axes[1, 1].set_title('notch=True,\nbootstrap=10000', fontsize=fs)

axes[1, 2].boxplot(data, labels=labels, showfliers=False)
axes[1, 2].set_title('showfliers=False', fontsize=fs)

for ax in axes.flatten():
    ax.set_yscale('log')
    ax.set_yticklabels([])

fig.subplots_adjust(hspace=0.4)
plt.show()
Demonstrate how to customize the display different elements:
boxprops = dict(linestyle='--', linewidth=3, color='darkgoldenrod')
flierprops = dict(marker='o', markerfacecolor='green', markersize=12,
                  linestyle='none')
medianprops = dict(linestyle='-.', linewidth=2.5, color='firebrick')
meanpointprops = dict(marker='D', markeredgecolor='black',
                      markerfacecolor='firebrick')
meanlineprops = dict(linestyle='--', linewidth=2.5, color='purple')

fig, axes = plt.subplots(nrows=2, ncols=3, figsize=(6, 6), sharey=True)
axes[0, 0].boxplot(data, boxprops=boxprops)
axes[0, 0].set_title('Custom boxprops', fontsize=fs)

axes[0, 1].boxplot(data, flierprops=flierprops, medianprops=medianprops)
axes[0, 1].set_title('Custom medianprops\nand flierprops', fontsize=fs)

axes[0, 2].boxplot(data, whis='range')
axes[0, 2].set_title('whis="range"', fontsize=fs)

axes[1, 0].boxplot(data, meanprops=meanpointprops, meanline=False,
                   showmeans=True)
axes[1, 0].set_title('Custom mean\nas point', fontsize=fs)

axes[1, 1].boxplot(data, meanprops=meanlineprops, meanline=True,
                   showmeans=True)
axes[1, 1].set_title('Custom mean\nas line', fontsize=fs)

axes[1, 2].boxplot(data, whis=[15, 85])
axes[1, 2].set_title('whis=[15, 85]\n#percentiles', fontsize=fs)

for ax in axes.flatten():
    ax.set_yscale('log')
    ax.set_yticklabels([])

fig.suptitle("I never said they'd be pretty")
fig.subplots_adjust(hspace=0.4)
plt.show()
Keywords: matplotlib code example, codex, python plot, pyplot Gallery generated by Sphinx-Gallery