Version 3.0.0
Note
Click here to download the full example code
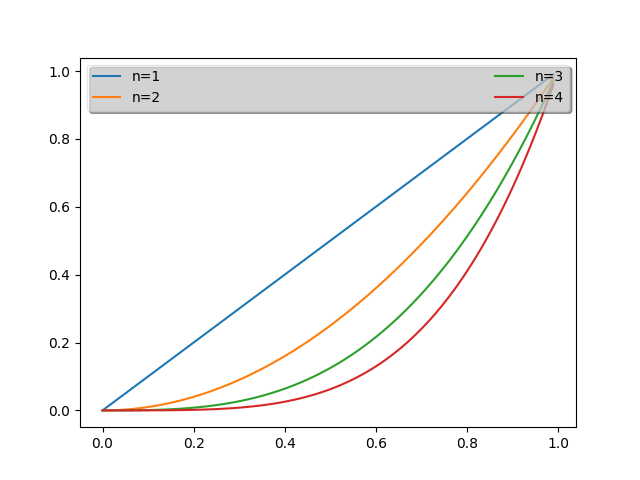
Create a legend and tweak it with a shadow and a box.
import matplotlib.pyplot as plt
import numpy as np


ax = plt.subplot(111)
t1 = np.arange(0.0, 1.0, 0.01)
for n in [1, 2, 3, 4]:
    plt.plot(t1, t1**n, label="n=%d"%(n,))

leg = plt.legend(loc='best', ncol=2, mode="expand", shadow=True, fancybox=True)
leg.get_frame().set_alpha(0.5)


plt.show()
The use of the following functions, methods, classes and modules is shown in this example:
Keywords: matplotlib code example, codex, python plot, pyplot Gallery generated by Sphinx-Gallery