Version 3.0.0
Note
Click here to download the full example code
The pyplot interface allows you to use setp and getp to set and get object properties, as well as to do introspection on the object
To set the linestyle of a line to be dashed, you can do:
If you want to know the valid types of arguments, you can provide the name of the property you want to set without a value:
>>> plt.setp(line, 'linestyle')
    linestyle: [ '-' | '--' | '-.' | ':' | 'steps' | 'None' ]
If you want to see all the properties that can be set, and their possible values, you can do:
>>> plt.setp(line)
set operates on a single instance or a list of instances. If you are in query mode introspecting the possible values, only the first instance in the sequence is used. When actually setting values, all the instances will be set. e.g., suppose you have a list of two lines, the following will make both lines thicker and red:
get returns the value of a given attribute. You can use get to query the value of a single attribute:
>>> plt.getp(line, 'linewidth')
    0.5
or all the attribute/value pairs:
>>> plt.getp(line)
    aa = True
    alpha = 1.0
    antialiased = True
    c = b
    clip_on = True
    color = b
    ... long listing skipped ...
To reduce keystrokes in interactive mode, a number of properties have short aliases, e.g., 'lw' for 'linewidth' and 'mec' for 'markeredgecolor'. When calling set or get in introspection mode, these properties will be listed as 'fullname or aliasname'.
Out:
Line setters
  agg_filter: a filter function, which takes a (m, n, 3) float array and a dpi value, and returns a (m, n, 3) array
  alpha: float
  animated: bool
  antialiased: bool
  clip_box: `.Bbox`
  clip_on: bool
  clip_path: [(`~matplotlib.path.Path`, `.Transform`) | `.Patch` | None]
  color: color
  contains: callable
  dash_capstyle: {'butt', 'round', 'projecting'}
  dash_joinstyle: {'miter', 'round', 'bevel'}
  dashes: sequence of floats (on/off ink in points) or (None, None)
  drawstyle: {'default', 'steps', 'steps-pre', 'steps-mid', 'steps-post'}
  figure: `.Figure`
  fillstyle: {'full', 'left', 'right', 'bottom', 'top', 'none'}
  gid: str
  in_layout: bool
  label: object
  linestyle: {'-', '--', '-.', ':', '', (offset, on-off-seq), ...}
  linewidth: float
  marker: unknown
  markeredgecolor: color
  markeredgewidth: float
  markerfacecolor: color
  markerfacecoloralt: color
  markersize: float
  markevery: unknown
  path_effects: `.AbstractPathEffect`
  picker: float or callable[[Artist, Event], Tuple[bool, dict]]
  pickradius: float
  rasterized: bool or None
  sketch_params: (scale: float, length: float, randomness: float)
  snap: bool or None
  solid_capstyle: {'butt', 'round', 'projecting'}
  solid_joinstyle: {'miter', 'round', 'bevel'}
  transform: matplotlib.transforms.Transform
  url: str
  visible: bool
  xdata: 1D array
  ydata: 1D array
  zorder: float
Line getters
    agg_filter = None
    alpha = None
    animated = False
    antialiased = True
    children = []
    clip_box = TransformedBbox(     Bbox(x0=0.0, y0=0.0, x1=1.0, ...
    clip_on = True
    clip_path = None
    color = r
    contains = None
    dash_capstyle = butt
    dash_joinstyle = round
    data = (array([0.  , 0.01, 0.02, 0.03, 0.04, 0.05, 0.06, ...
    drawstyle = default
    figure = Figure(640x480)
    fillstyle = full
    gid = None
    in_layout = True
    label = _line0
    linestyle = --
    linewidth = 2.0
    marker = None
    markeredgecolor = r
    markeredgewidth = 1.0
    markerfacecolor = r
    markerfacecoloralt = none
    markersize = 6.0
    markevery = None
    path = Path(array([[ 0.00000000e+00,  0.00000000e+00],   ...
    path_effects = []
    picker = None
    pickradius = 5
    rasterized = None
    sketch_params = None
    snap = None
    solid_capstyle = projecting
    solid_joinstyle = round
    transform = CompositeGenericTransform(     TransformWrapper(  ...
    transformed_clip_path_and_affine = (None, None)
    url = None
    visible = True
    xdata = [0.   0.01 0.02 0.03 0.04 0.05]...
    xydata = [[0.         0.        ]  [0.01       0.06279052] ...
    ydata = [0.         0.06279052 0.12533323 0.18738131 0.248...
    zorder = 2
Rectangle setters
  agg_filter: a filter function, which takes a (m, n, 3) float array and a dpi value, and returns a (m, n, 3) array
  alpha: float or None
  animated: bool
  antialiased: unknown
  capstyle: {'butt', 'round', 'projecting'}
  clip_box: `.Bbox`
  clip_on: bool
  clip_path: [(`~matplotlib.path.Path`, `.Transform`) | `.Patch` | None]
  color: color
  contains: callable
  edgecolor: color or None or 'auto'
  facecolor: color or None
  figure: `.Figure`
  fill: bool
  gid: str
  hatch: {'/', '\\', '|', '-', '+', 'x', 'o', 'O', '.', '*'}
  height: unknown
  in_layout: bool
  joinstyle: {'miter', 'round', 'bevel'}
  label: object
  linestyle: {'-', '--', '-.', ':', '', (offset, on-off-seq), ...}
  linewidth: float or None for default
  path_effects: `.AbstractPathEffect`
  picker: None or bool or float or callable
  rasterized: bool or None
  sketch_params: (scale: float, length: float, randomness: float)
  snap: bool or None
  transform: `.Transform`
  url: str
  visible: bool
  width: unknown
  x: unknown
  xy: 2-item sequence
  y: unknown
  zorder: float
Rectangle getters
    agg_filter = None
    alpha = None
    animated = False
    antialiased = True
    bbox = Bbox(x0=0.0, y0=0.0, x1=1.0, y1=1.0)
    capstyle = butt
    children = []
    clip_box = None
    clip_on = True
    clip_path = None
    contains = None
    data_transform = BboxTransformTo(     TransformedBbox(         Bbox...
    edgecolor = (0.0, 0.0, 0.0, 0.0)
    extents = Bbox(x0=80.0, y0=52.8, x1=576.0, y1=422.4)
    facecolor = (1.0, 1.0, 1.0, 1.0)
    figure = Figure(640x480)
    fill = True
    gid = None
    hatch = None
    height = 1.0
    in_layout = True
    joinstyle = miter
    label =
    linestyle = solid
    linewidth = 0.0
    patch_transform = CompositeGenericTransform(     BboxTransformTo(   ...
    path = Path(array([[0., 0.],        [1., 0.],        [1.,...
    path_effects = []
    picker = None
    rasterized = None
    sketch_params = None
    snap = None
    transform = CompositeGenericTransform(     CompositeGenericTra...
    transformed_clip_path_and_affine = (None, None)
    url = None
    verts = [[ 80.   52.8]  [576.   52.8]  [576.  422.4]  [ 80...
    visible = True
    width = 1.0
    window_extent = Bbox(x0=80.0, y0=52.8, x1=576.0, y1=422.4)
    x = 0.0
    xy = (0.0, 0.0)
    y = 0.0
    zorder = 1
Text setters
  agg_filter: a filter function, which takes a (m, n, 3) float array and a dpi value, and returns a (m, n, 3) array
  alpha: float
  animated: bool
  backgroundcolor: color
  bbox: dict with properties for `.patches.FancyBboxPatch`
  clip_box: `matplotlib.transforms.Bbox`
  clip_on: bool
  clip_path: { (`.path.Path`, `.transforms.Transform`), `.patches.Patch`, None }
  color: color
  contains: callable
  figure: `.Figure`
  fontfamily: {FONTNAME, 'serif', 'sans-serif', 'cursive', 'fantasy', 'monospace'}
  fontname: {FONTNAME, 'serif', 'sans-serif', 'cursive', 'fantasy', 'monospace'}
  fontproperties: `.font_manager.FontProperties`
  fontsize: {size in points, 'xx-small', 'x-small', 'small', 'medium', 'large', 'x-large', 'xx-large'}
  fontstretch: {a numeric value in range 0-1000, 'ultra-condensed', 'extra-condensed', 'condensed', 'semi-condensed', 'normal', 'semi-expanded', 'expanded', 'extra-expanded', 'ultra-expanded'}
  fontstyle: {'normal', 'italic', 'oblique'}
  fontvariant: {'normal', 'small-caps'}
  fontweight: {a numeric value in range 0-1000, 'ultralight', 'light', 'normal', 'regular', 'book', 'medium', 'roman', 'semibold', 'demibold', 'demi', 'bold', 'heavy', 'extra bold', 'black'}
  gid: str
  horizontalalignment: {'center', 'right', 'left'}
  in_layout: bool
  label: object
  linespacing: float (multiple of font size)
  multialignment: {'left', 'right', 'center'}
  path_effects: `.AbstractPathEffect`
  picker: None or bool or float or callable
  position: (float, float)
  rasterized: bool or None
  rotation: {angle in degrees, 'vertical', 'horizontal'}
  rotation_mode: {None, 'default', 'anchor'}
  sketch_params: (scale: float, length: float, randomness: float)
  snap: bool or None
  text: string or object castable to string (but ``None`` becomes ``''``)
  transform: `.Transform`
  url: str
  usetex: bool or None
  verticalalignment: {'center', 'top', 'bottom', 'baseline', 'center_baseline'}
  visible: bool
  wrap: bool
  x: float
  y: float
  zorder: float
Text getters
    agg_filter = None
    alpha = None
    animated = False
    bbox_patch = None
    children = []
    clip_box = None
    clip_on = True
    clip_path = None
    color = black
    contains = None
    figure = Figure(640x480)
    fontfamily = ['sans-serif']
    fontname = DejaVu Sans
    fontproperties = :family=sans-serif:style=normal:variant=normal:wei...
    fontsize = 12.0
    fontstyle = normal
    fontvariant = normal
    fontweight = normal
    gid = None
    horizontalalignment = center
    in_layout = True
    label =
    path_effects = []
    picker = None
    position = (0.5, 1.0)
    rasterized = None
    rotation = 0.0
    rotation_mode = None
    sketch_params = None
    snap = None
    stretch = normal
    text = Hi mom
    transform = CompositeGenericTransform(     BboxTransformTo(   ...
    transformed_clip_path_and_affine = (None, None)
    unitless_position = (0.5, 1.0)
    url = None
    usetex = False
    verticalalignment = baseline
    visible = True
    wrap = False
    zorder = 3
import matplotlib.pyplot as plt
import numpy as np
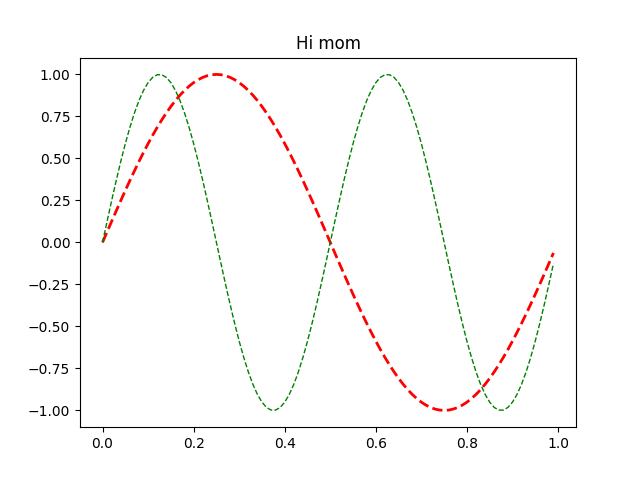
x = np.arange(0, 1.0, 0.01)
y1 = np.sin(2*np.pi*x)
y2 = np.sin(4*np.pi*x)
lines = plt.plot(x, y1, x, y2)
l1, l2 = lines
plt.setp(lines, linestyle='--') # set both to dashed
plt.setp(l1, linewidth=2, color='r') # line1 is thick and red
plt.setp(l2, linewidth=1, color='g') # line2 is thinner and green
print('Line setters')
plt.setp(l1)
print('Line getters')
plt.getp(l1)
print('Rectangle setters')
plt.setp(plt.gca().patch)
print('Rectangle getters')
plt.getp(plt.gca().patch)
t = plt.title('Hi mom')
print('Text setters')
plt.setp(t)
print('Text getters')
plt.getp(t)
plt.show()
Keywords: matplotlib code example, codex, python plot, pyplot Gallery generated by Sphinx-Gallery