Version 3.0.0
Note
Click here to download the full example code
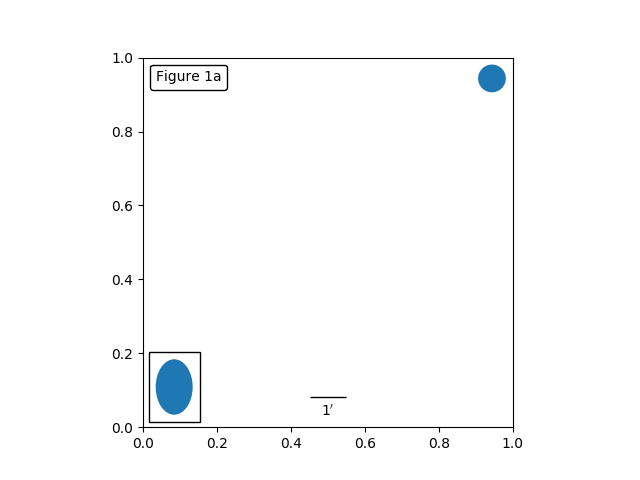
This example illustrates the use of the anchored objects without the helper classes found in the Matplotlib axes_grid1 Toolkit. This version of the figure is similar to the one found in Simple Anchored Artists, but it is implemented using only the matplotlib namespace, without the help of additional toolkits.
from matplotlib import pyplot as plt
from matplotlib.patches import Rectangle, Ellipse
from matplotlib.offsetbox import (
    AnchoredOffsetbox, AuxTransformBox, DrawingArea, TextArea, VPacker)


class AnchoredText(AnchoredOffsetbox):
    def __init__(self, s, loc, pad=0.4, borderpad=0.5,
                 prop=None, frameon=True):
        self.txt = TextArea(s, minimumdescent=False)
        super().__init__(loc, pad=pad, borderpad=borderpad,
                         child=self.txt, prop=prop, frameon=frameon)


def draw_text(ax):
    """
    Draw a text-box anchored to the upper-left corner of the figure.
    """
    at = AnchoredText("Figure 1a", loc='upper left', frameon=True)
    at.patch.set_boxstyle("round,pad=0.,rounding_size=0.2")
    ax.add_artist(at)


class AnchoredDrawingArea(AnchoredOffsetbox):
    def __init__(self, width, height, xdescent, ydescent,
                 loc, pad=0.4, borderpad=0.5, prop=None, frameon=True):
        self.da = DrawingArea(width, height, xdescent, ydescent)
        super().__init__(loc, pad=pad, borderpad=borderpad,
                         child=self.da, prop=None, frameon=frameon)


def draw_circle(ax):
    """
    Draw a circle in axis coordinates
    """
    from matplotlib.patches import Circle
    ada = AnchoredDrawingArea(20, 20, 0, 0,
                              loc='upper right', pad=0., frameon=False)
    p = Circle((10, 10), 10)
    ada.da.add_artist(p)
    ax.add_artist(ada)


class AnchoredEllipse(AnchoredOffsetbox):
    def __init__(self, transform, width, height, angle, loc,
                 pad=0.1, borderpad=0.1, prop=None, frameon=True):
        """
        Draw an ellipse the size in data coordinate of the give axes.

        pad, borderpad in fraction of the legend font size (or prop)
        """
        self._box = AuxTransformBox(transform)
        self.ellipse = Ellipse((0, 0), width, height, angle)
        self._box.add_artist(self.ellipse)
        super().__init__(loc, pad=pad, borderpad=borderpad,
                         child=self._box, prop=prop, frameon=frameon)


def draw_ellipse(ax):
    """
    Draw an ellipse of width=0.1, height=0.15 in data coordinates
    """
    ae = AnchoredEllipse(ax.transData, width=0.1, height=0.15, angle=0.,
                         loc='lower left', pad=0.5, borderpad=0.4,
                         frameon=True)

    ax.add_artist(ae)


class AnchoredSizeBar(AnchoredOffsetbox):
    def __init__(self, transform, size, label, loc,
                 pad=0.1, borderpad=0.1, sep=2, prop=None, frameon=True):
        """
        Draw a horizontal bar with the size in data coordinate of the given
        axes. A label will be drawn underneath (center-aligned).

        pad, borderpad in fraction of the legend font size (or prop)
        sep in points.
        """
        self.size_bar = AuxTransformBox(transform)
        self.size_bar.add_artist(Rectangle((0, 0), size, 0, ec="black", lw=1.0))

        self.txt_label = TextArea(label, minimumdescent=False)

        self._box = VPacker(children=[self.size_bar, self.txt_label],
                            align="center",
                            pad=0, sep=sep)

        super().__init__(loc, pad=pad, borderpad=borderpad,
                         child=self._box, prop=prop, frameon=frameon)


def draw_sizebar(ax):
    """
    Draw a horizontal bar with length of 0.1 in data coordinates,
    with a fixed label underneath.
    """
    asb = AnchoredSizeBar(ax.transData,
                          0.1,
                          r"1$^{\prime}$",
                          loc='lower center',
                          pad=0.1, borderpad=0.5, sep=5,
                          frameon=False)
    ax.add_artist(asb)


ax = plt.gca()
ax.set_aspect(1.)

draw_text(ax)
draw_circle(ax)
draw_ellipse(ax)
draw_sizebar(ax)

plt.show()
Keywords: matplotlib code example, codex, python plot, pyplot Gallery generated by Sphinx-Gallery