Version 3.0.0
Note
Click here to download the full example code
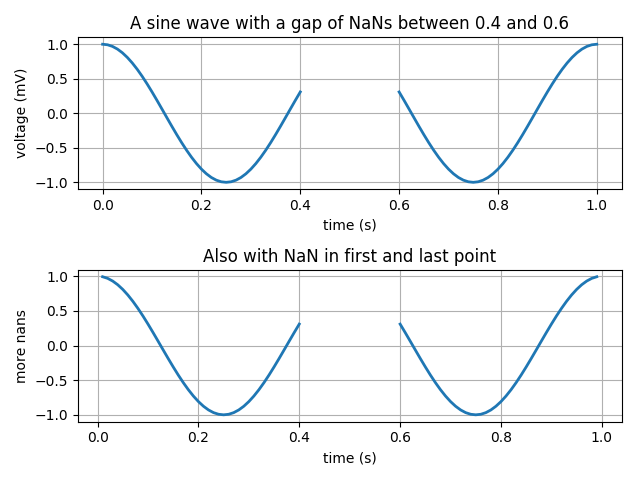
Example: simple line plots with NaNs inserted.
import numpy as np
import matplotlib.pyplot as plt

t = np.arange(0.0, 1.0 + 0.01, 0.01)
s = np.cos(2 * 2*np.pi * t)
t[41:60] = np.nan

plt.subplot(2, 1, 1)
plt.plot(t, s, '-', lw=2)

plt.xlabel('time (s)')
plt.ylabel('voltage (mV)')
plt.title('A sine wave with a gap of NaNs between 0.4 and 0.6')
plt.grid(True)

plt.subplot(2, 1, 2)
t[0] = np.nan
t[-1] = np.nan
plt.plot(t, s, '-', lw=2)
plt.title('Also with NaN in first and last point')

plt.xlabel('time (s)')
plt.ylabel('more nans')
plt.grid(True)

plt.tight_layout()
plt.show()
Keywords: matplotlib code example, codex, python plot, pyplot Gallery generated by Sphinx-Gallery