Version 3.0.0
Note
Click here to download the full example code
How to use categorical variables in Matplotlib.
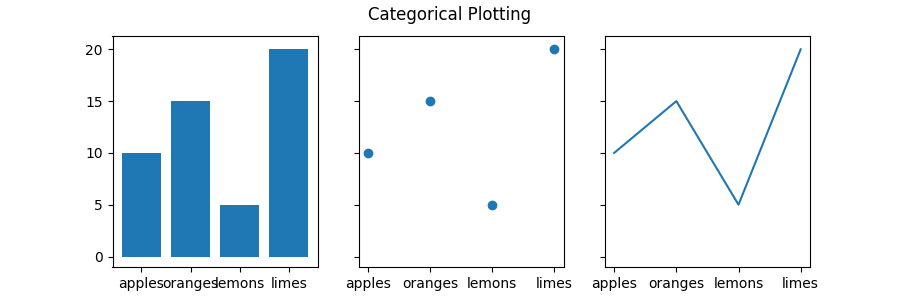
Many times you want to create a plot that uses categorical variables in Matplotlib. Matplotlib allows you to pass categorical variables directly to many plotting functions, which we demonstrate below.
import matplotlib.pyplot as plt

data = {'apples': 10, 'oranges': 15, 'lemons': 5, 'limes': 20}
names = list(data.keys())
values = list(data.values())

fig, axs = plt.subplots(1, 3, figsize=(9, 3), sharey=True)
axs[0].bar(names, values)
axs[1].scatter(names, values)
axs[2].plot(names, values)
fig.suptitle('Categorical Plotting')
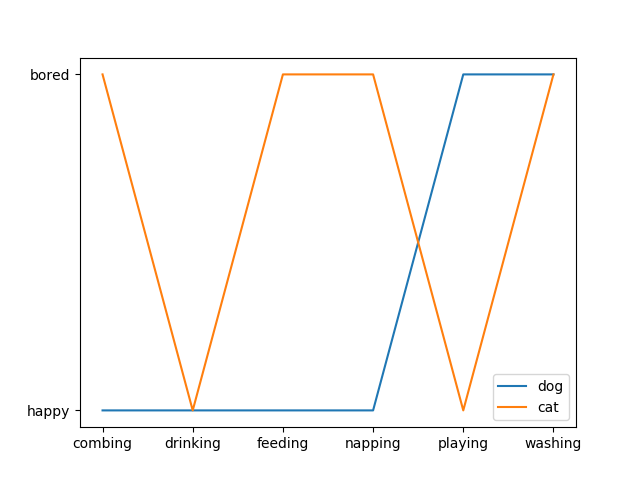
This works on both axes:
cat = ["bored", "happy", "bored", "bored", "happy", "bored"]
dog = ["happy", "happy", "happy", "happy", "bored", "bored"]
activity = ["combing", "drinking", "feeding", "napping", "playing", "washing"]

fig, ax = plt.subplots()
ax.plot(activity, dog, label="dog")
ax.plot(activity, cat, label="cat")
ax.legend()

plt.show()
Keywords: matplotlib code example, codex, python plot, pyplot Gallery generated by Sphinx-Gallery