Version 3.0.0
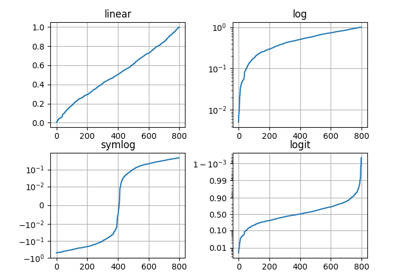
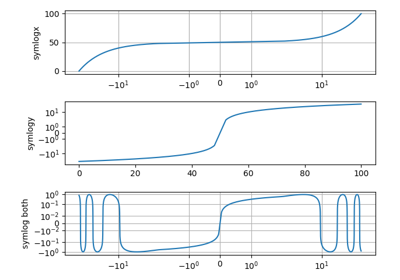
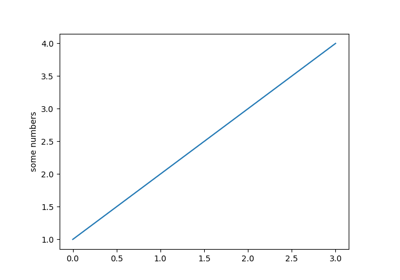
matplotlib.pyplot.yscale(value, **kwargs)[source]¶Set the y-axis scale.
| Parameters: |
|
|---|
See also
matplotlib.scale.LinearScalematplotlib.scale.LogTransformmatplotlib.scale.SymmetricalLogTransformmatplotlib.scale.LogisticTransformNotes
Different kwargs are accepted, depending on the scale. See
the scale module for more information.