Version 3.0.0
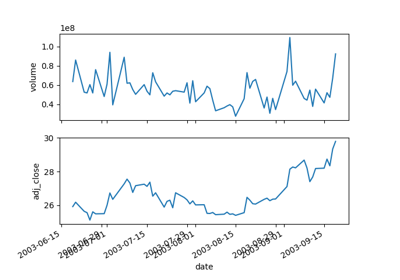
matplotlib.pyplot.plotfile(fname, cols=(0, ), plotfuncs=None, comments='#', skiprows=0, checkrows=5, delimiter=', ', names=None, subplots=True, newfig=True, **kwargs)[source]¶Plot the data in a file.
cols is a sequence of column identifiers to plot. An identifier
is either an int or a string. If it is an int, it indicates the
column number. If it is a string, it indicates the column header.
matplotlib will make column headers lower case, replace spaces with
underscores, and remove all illegal characters; so 'Adj Close*'
will have name 'adj_close'.
plotfuncs, if not None, is a dictionary mapping identifier to
an Axes plotting function as a string.
Default is 'plot', other choices are 'semilogy', 'fill', 'bar',
etc. You must use the same type of identifier in the cols
vector as you use in the plotfuncs dictionary, e.g., integer
column numbers in both or column names in both. If subplots
is False, then including any function such as 'semilogy'
that changes the axis scaling will set the scaling for all
columns.
comments, skiprows, checkrows, delimiter, and names
are all passed on to matplotlib.mlab.csv2rec() to
load the data into a record array.
If newfig is True, the plot always will be made in a new figure; if False, it will be made in the current figure if one exists, else in a new figure.
kwargs are passed on to plotting functions.
Example usage:
# plot the 2nd and 4th column against the 1st in two subplots
plotfile(fname, (0,1,3))

# plot using column names; specify an alternate plot type for volume
plotfile(fname, ('date', 'volume', 'adj_close'),
                              plotfuncs={'volume': 'semilogy'})
Note: plotfile is intended as a convenience for quickly plotting data from flat files; it is not intended as an alternative interface to general plotting with pyplot or matplotlib.
matplotlib.pyplot.plotfile