Version 3.0.0
matplotlib.colors.SymLogNorm(linthresh, linscale=1.0, vmin=None, vmax=None, clip=False)[source]¶Bases: matplotlib.colors.Normalize
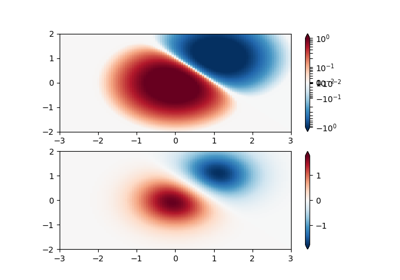
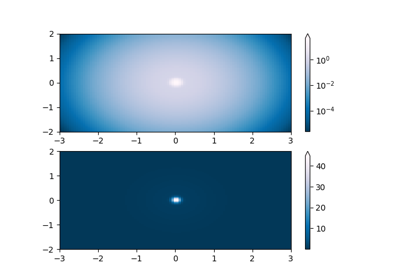
The symmetrical logarithmic scale is logarithmic in both the positive and negative directions from the origin.
Since the values close to zero tend toward infinity, there is a need to have a range around zero that is linear. The parameter linthresh allows the user to specify the size of this range (-linthresh, linthresh).
linthresh: The range within which the plot is linear (to avoid having the plot go to infinity around zero).
linscale: This allows the linear range (-linthresh to linthresh) to be stretched relative to the logarithmic range. Its value is the number of decades to use for each half of the linear range. For example, when linscale == 1.0 (the default), the space used for the positive and negative halves of the linear range will be equal to one decade in the logarithmic range. Defaults to 1.
matplotlib.colors.SymLogNorm