Version 2.2.5
Note
Click here to download the full example code
Demonstrate how to use major and minor tickers.
The two relevant userland classes are Locators and Formatters. Locators determine where the ticks are and formatters control the formatting of ticks.
Minor ticks are off by default (NullLocator and NullFormatter). You can turn minor ticks on w/o labels by setting the minor locator. You can also turn labeling on for the minor ticker by setting the minor formatter
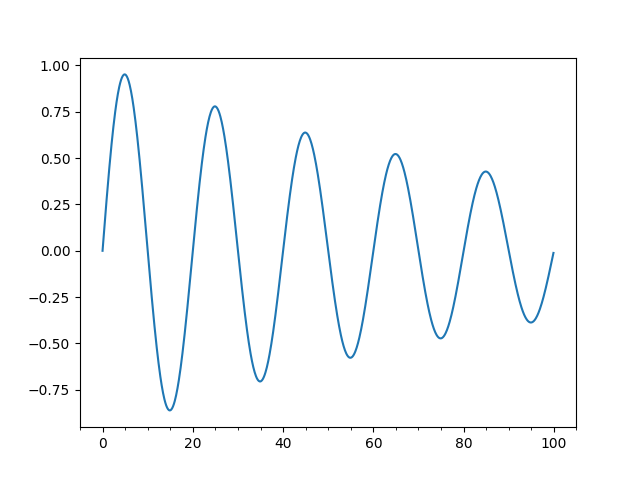
Make a plot with major ticks that are multiples of 20 and minor ticks that are multiples of 5. Label major ticks with %d formatting but don't label minor ticks
The MultipleLocator ticker class is used to place ticks on multiples of some base. The FormatStrFormatter uses a string format string (e.g., '%d' or '%1.2f' or '%1.1f cm' ) to format the tick
The pyplot interface grid command changes the grid settings of the major ticks of the y and y axis together. If you want to control the grid of the minor ticks for a given axis, use for example
ax.xaxis.grid(True, which='minor')
Note, you should not use the same locator between different Axis because the locator stores references to the Axis data and view limits
import matplotlib.pyplot as plt
import numpy as np
from matplotlib.ticker import (MultipleLocator, FormatStrFormatter,
                               AutoMinorLocator)

majorLocator = MultipleLocator(20)
majorFormatter = FormatStrFormatter('%d')
minorLocator = MultipleLocator(5)


t = np.arange(0.0, 100.0, 0.1)
s = np.sin(0.1 * np.pi * t) * np.exp(-t * 0.01)

fig, ax = plt.subplots()
ax.plot(t, s)

ax.xaxis.set_major_locator(majorLocator)
ax.xaxis.set_major_formatter(majorFormatter)

# for the minor ticks, use no labels; default NullFormatter
ax.xaxis.set_minor_locator(minorLocator)

plt.show()
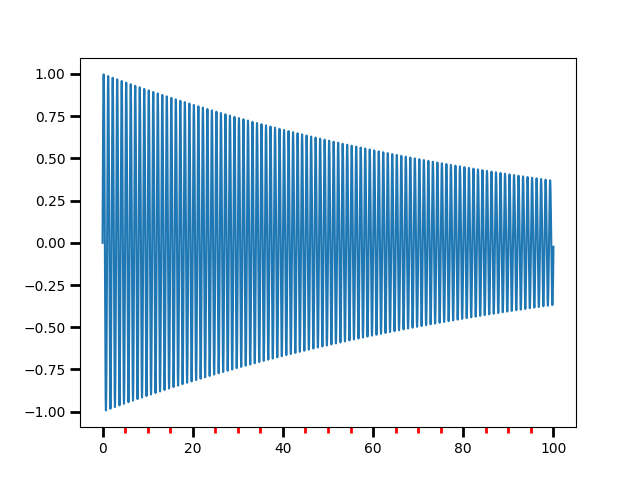
Automatic tick selection for major and minor ticks.
Use interactive pan and zoom to see how the tick intervals change. There will be either 4 or 5 minor tick intervals per major interval, depending on the major interval.
One can supply an argument to AutoMinorLocator to specify a fixed number of minor intervals per major interval, e.g.: minorLocator = AutoMinorLocator(2) would lead to a single minor tick between major ticks.
minorLocator = AutoMinorLocator()


t = np.arange(0.0, 100.0, 0.01)
s = np.sin(2 * np.pi * t) * np.exp(-t * 0.01)

fig, ax = plt.subplots()
ax.plot(t, s)

ax.xaxis.set_minor_locator(minorLocator)

ax.tick_params(which='both', width=2)
ax.tick_params(which='major', length=7)
ax.tick_params(which='minor', length=4, color='r')

plt.show()
Keywords: matplotlib code example, codex, python plot, pyplot Gallery generated by Sphinx-Gallery