Version 2.2.5
Note
Click here to download the full example code
import numpy as np
import matplotlib.pyplot as plt
import matplotlib.ticker as ticker
# Fixing random state for reproducibility
np.random.seed(19680801)
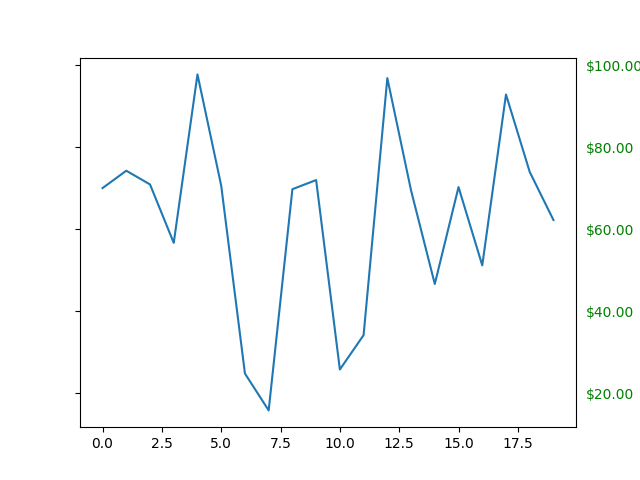
fig, ax = plt.subplots()
ax.plot(100*np.random.rand(20))
formatter = ticker.FormatStrFormatter('$%1.2f')
ax.yaxis.set_major_formatter(formatter)
for tick in ax.yaxis.get_major_ticks():
tick.label1On = False
tick.label2On = True
tick.label2.set_color('green')
plt.show()
Keywords: matplotlib code example, codex, python plot, pyplot Gallery generated by Sphinx-Gallery