Version 2.2.5
Note
Click here to download the full example code
import numpy as np
import matplotlib.pyplot as plt
box = dict(facecolor='yellow', pad=5, alpha=0.2)
fig, ((ax1, ax2), (ax3, ax4)) = plt.subplots(2, 2)
fig.subplots_adjust(left=0.2, wspace=0.6)
# Fixing random state for reproducibility
np.random.seed(19680801)
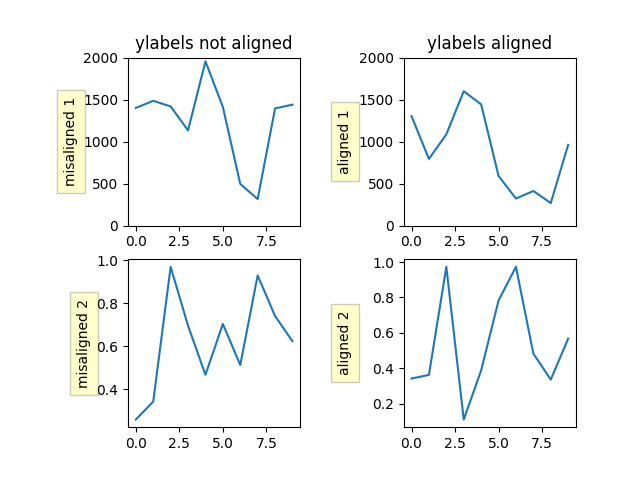
ax1.plot(2000*np.random.rand(10))
ax1.set_title('ylabels not aligned')
ax1.set_ylabel('misaligned 1', bbox=box)
ax1.set_ylim(0, 2000)
ax3.set_ylabel('misaligned 2',bbox=box)
ax3.plot(np.random.rand(10))
labelx = -0.3 # axes coords
ax2.set_title('ylabels aligned')
ax2.plot(2000*np.random.rand(10))
ax2.set_ylabel('aligned 1', bbox=box)
ax2.yaxis.set_label_coords(labelx, 0.5)
ax2.set_ylim(0, 2000)
ax4.plot(np.random.rand(10))
ax4.set_ylabel('aligned 2', bbox=box)
ax4.yaxis.set_label_coords(labelx, 0.5)
plt.show()
Keywords: matplotlib code example, codex, python plot, pyplot Gallery generated by Sphinx-Gallery