Version 2.2.5
Note
Click here to download the full example code
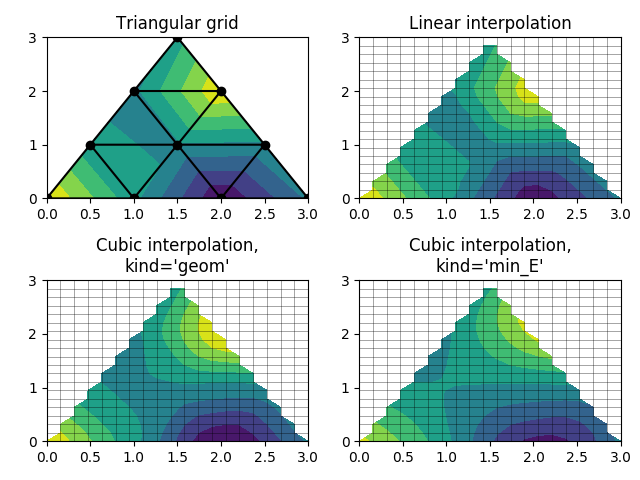
Interpolation from triangular grid to quad grid.
import matplotlib.pyplot as plt
import matplotlib.tri as mtri
import numpy as np

# Create triangulation.
x = np.asarray([0, 1, 2, 3, 0.5, 1.5, 2.5, 1, 2, 1.5])
y = np.asarray([0, 0, 0, 0, 1.0, 1.0, 1.0, 2, 2, 3.0])
triangles = [[0, 1, 4], [1, 2, 5], [2, 3, 6], [1, 5, 4], [2, 6, 5], [4, 5, 7],
             [5, 6, 8], [5, 8, 7], [7, 8, 9]]
triang = mtri.Triangulation(x, y, triangles)

# Interpolate to regularly-spaced quad grid.
z = np.cos(1.5 * x) * np.cos(1.5 * y)
xi, yi = np.meshgrid(np.linspace(0, 3, 20), np.linspace(0, 3, 20))

interp_lin = mtri.LinearTriInterpolator(triang, z)
zi_lin = interp_lin(xi, yi)

interp_cubic_geom = mtri.CubicTriInterpolator(triang, z, kind='geom')
zi_cubic_geom = interp_cubic_geom(xi, yi)

interp_cubic_min_E = mtri.CubicTriInterpolator(triang, z, kind='min_E')
zi_cubic_min_E = interp_cubic_min_E(xi, yi)

# Set up the figure
fig, axs = plt.subplots(nrows=2, ncols=2)
axs = axs.flatten()

# Plot the triangulation.
axs[0].tricontourf(triang, z)
axs[0].triplot(triang, 'ko-')
axs[0].set_title('Triangular grid')

# Plot linear interpolation to quad grid.
axs[1].contourf(xi, yi, zi_lin)
axs[1].plot(xi, yi, 'k-', lw=0.5, alpha=0.5)
axs[1].plot(xi.T, yi.T, 'k-', lw=0.5, alpha=0.5)
axs[1].set_title("Linear interpolation")

# Plot cubic interpolation to quad grid, kind=geom
axs[2].contourf(xi, yi, zi_cubic_geom)
axs[2].plot(xi, yi, 'k-', lw=0.5, alpha=0.5)
axs[2].plot(xi.T, yi.T, 'k-', lw=0.5, alpha=0.5)
axs[2].set_title("Cubic interpolation,\nkind='geom'")

# Plot cubic interpolation to quad grid, kind=min_E
axs[3].contourf(xi, yi, zi_cubic_min_E)
axs[3].plot(xi, yi, 'k-', lw=0.5, alpha=0.5)
axs[3].plot(xi.T, yi.T, 'k-', lw=0.5, alpha=0.5)
axs[3].set_title("Cubic interpolation,\nkind='min_E'")

fig.tight_layout()
plt.show()
The use of the following functions, methods, classes and modules is shown in this example:
import matplotlib
matplotlib.axes.Axes.tricontourf
matplotlib.pyplot.tricontourf
matplotlib.axes.Axes.triplot
matplotlib.pyplot.triplot
matplotlib.axes.Axes.contourf
matplotlib.pyplot.contourf
matplotlib.axes.Axes.plot
matplotlib.pyplot.plot
matplotlib.tri
matplotlib.tri.LinearTriInterpolator
matplotlib.tri.CubicTriInterpolator
matplotlib.tri.Triangulation
Keywords: matplotlib code example, codex, python plot, pyplot Gallery generated by Sphinx-Gallery