Version 2.2.5
Note
Click here to download the full example code
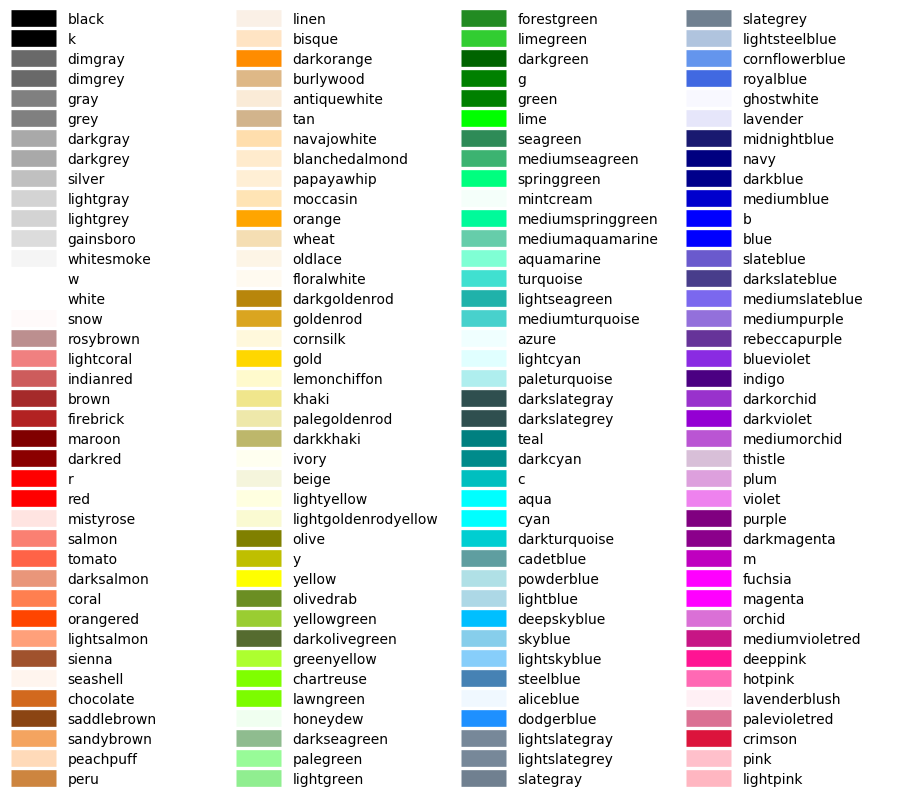
Simple plot example with the named colors and its visual representation.
For more information on colors in matplotlib see
matplotlib.colors API;from __future__ import division
import matplotlib.pyplot as plt
from matplotlib import colors as mcolors
colors = dict(mcolors.BASE_COLORS, **mcolors.CSS4_COLORS)
# Sort colors by hue, saturation, value and name.
by_hsv = sorted((tuple(mcolors.rgb_to_hsv(mcolors.to_rgba(color)[:3])), name)
for name, color in colors.items())
sorted_names = [name for hsv, name in by_hsv]
n = len(sorted_names)
ncols = 4
nrows = n // ncols
fig, ax = plt.subplots(figsize=(9, 8))
# Get height and width
X, Y = fig.get_dpi() * fig.get_size_inches()
h = Y / (nrows + 1)
w = X / ncols
for i, name in enumerate(sorted_names):
row = i % nrows
col = i // nrows
y = Y - (row * h) - h
xi_line = w * (col + 0.05)
xf_line = w * (col + 0.25)
xi_text = w * (col + 0.3)
ax.text(xi_text, y, name, fontsize=(h * 0.5),
horizontalalignment='left',
verticalalignment='center')
ax.hlines(y + h * 0.1, xi_line, xf_line,
color=colors[name], linewidth=(h * 0.6))
ax.set_xlim(0, X)
ax.set_ylim(0, Y)
ax.set_axis_off()
fig.subplots_adjust(left=0, right=1,
top=1, bottom=0,
hspace=0, wspace=0)
plt.show()
The use of the following functions, methods, classes and modules is shown in this example:
import matplotlib
matplotlib.colors
matplotlib.colors.rgb_to_hsv
matplotlib.colors.to_rgba
matplotlib.figure.Figure.get_size_inches
matplotlib.figure.Figure.subplots_adjust
matplotlib.axes.Axes.text
matplotlib.axes.Axes.hlines
Out:
<function Axes.hlines at 0x7fd7573b4af0>
Keywords: matplotlib code example, codex, python plot, pyplot Gallery generated by Sphinx-Gallery