Version 2.2.5
Note
Click here to download the full example code
import matplotlib.pyplot as plt
import mpl_toolkits.axisartist as axisartist
def setup_axes(fig, rect):
ax = axisartist.Subplot(fig, rect)
fig.add_axes(ax)
ax.set_ylim(-0.1, 1.5)
ax.set_yticks([0, 1])
#ax.axis[:].toggle(all=False)
#ax.axis[:].line.set_visible(False)
ax.axis[:].set_visible(False)
ax.axis["x"] = ax.new_floating_axis(1, 0.5)
ax.axis["x"].set_axisline_style("->", size=1.5)
return ax
fig = plt.figure(figsize=(6, 2.5))
fig.subplots_adjust(bottom=0.2, top=0.8)
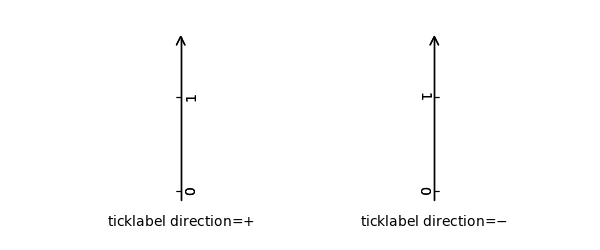
ax1 = setup_axes(fig, "121")
ax1.axis["x"].set_ticklabel_direction("+")
ax1.annotate("ticklabel direction=$+$", (0.5, 0), xycoords="axes fraction",
xytext=(0, -10), textcoords="offset points",
va="top", ha="center")
ax2 = setup_axes(fig, "122")
ax2.axis["x"].set_ticklabel_direction("-")
ax2.annotate("ticklabel direction=$-$", (0.5, 0), xycoords="axes fraction",
xytext=(0, -10), textcoords="offset points",
va="top", ha="center")
plt.show()
Keywords: matplotlib code example, codex, python plot, pyplot Gallery generated by Sphinx-Gallery