You are reading an old version of the documentation (v2.2.5). For the latest version see https://matplotlib.org/stable/api/_as_gen/mpl_toolkits.axes_grid1.anchored_artists.AnchoredSizeBar.html
Version 2.2.5
matplotlib
Fork me on GitHub

Table of Contents

mpl_toolkits.axes_grid1.anchored_artists.AnchoredSizeBar

class 
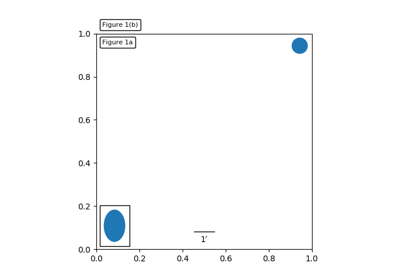
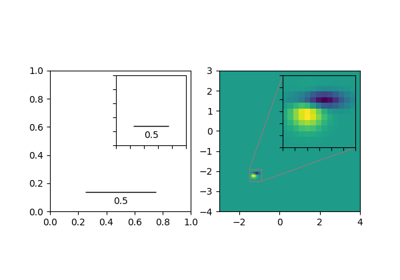
mpl_toolkits.axes_grid1.anchored_artists.AnchoredSizeBar(transform, size, label, loc, pad=0.1, borderpad=0.1, sep=2, frameon=True, size_vertical=0, color='black', label_top=False, fontproperties=None, fill_bar=None, **kwargs)[source]

Draw a horizontal scale bar with a center-aligned label underneath.

Parameters:
transform : matplotlib.transforms.Transform

The transformation object for the coordinate system in use, i.e., matplotlib.axes.Axes.transData.

size : int or float

Horizontal length of the size bar, given in coordinates of transform.

label : str

Label to display.

loc : int

Location of this size bar. Valid location codes are:

'upper right'  : 1,
'upper left'   : 2,
'lower left'   : 3,
'lower right'  : 4,
'right'        : 5,
'center left'  : 6,
'center right' : 7,
'lower center' : 8,
'upper center' : 9,
'center'       : 10
pad : int or float, optional

Padding around the label and size bar, in fraction of the font size. Defaults to 0.1.

borderpad : int or float, optional

Border padding, in fraction of the font size. Defaults to 0.1.

sep : int or float, optional

Separation between the label and the size bar, in points. Defaults to 2.

frameon : bool, optional

If True, draw a box around the horizontal bar and label. Defaults to True.

size_vertical : int or float, optional

Vertical length of the size bar, given in coordinates of transform. Defaults to 0.

color : str, optional

Color for the size bar and label. Defaults to black.

label_top : bool, optional

If True, the label will be over the size bar. Defaults to False.

fontproperties : matplotlib.font_manager.FontProperties, optional

Font properties for the label text.

fill_bar : bool, optional

If True and if size_vertical is nonzero, the size bar will be filled in with the color specified by the size bar. Defaults to True if size_vertical is greater than zero and False otherwise.

**kwargs :

Keyworded arguments to pass to matplotlib.offsetbox.AnchoredOffsetbox.

Notes

If prop is passed as a keyworded argument, but fontproperties is not, then prop is be assumed to be the intended fontproperties. Using both prop and fontproperties is not supported.

Examples

>>> import matplotlib.pyplot as plt
>>> import numpy as np
>>> from mpl_toolkits.axes_grid1.anchored_artists import AnchoredSizeBar
>>> fig, ax = plt.subplots()
>>> ax.imshow(np.random.random((10,10)))
>>> bar = AnchoredSizeBar(ax.transData, 3, '3 data units', 4)
>>> ax.add_artist(bar)
>>> fig.show()

Using all the optional parameters

>>> import matplotlib.font_manager as fm
>>> fontprops = fm.FontProperties(size=14, family='monospace')
>>> bar = AnchoredSizeBar(ax.transData, 3, '3 units', 4, pad=0.5, sep=5, borderpad=0.5, frameon=False, size_vertical=0.5, color='white', fontproperties=fontprops)
Attributes:
size_bar : matplotlib.offsetbox.AuxTransformBox

Container for the size bar.

txt_label : matplotlib.offsetbox.TextArea

Container for the label of the size bar.

Examples using mpl_toolkits.axes_grid1.anchored_artists.AnchoredSizeBar