| Parameters: |
- C : array_like
A scalar 2-D array. The values will be color-mapped.
- X, Y : array_like, optional
The coordinates of the quadrilateral corners. The quadrilateral
for C[i,j] has corners at:
(X[i+1, j], Y[i+1, j])          (X[i+1, j+1], Y[i+1, j+1])
                      +--------+
                      | C[i,j] |
                      +--------+
    (X[i, j], Y[i, j])          (X[i, j+1], Y[i, j+1]),
Note that the column index corresponds to the
x-coordinate, and the row index corresponds to y. For
details, see the Notes
section below.
The dimensions of X and Y should be one greater than those of
C. Alternatively, X, Y and C may have equal dimensions, in
which case the last row and column of C will be ignored.
If X and/or Y are 1-D arrays or column vectors they will be
expanded as needed into the appropriate 2-D arrays, making a
rectangular grid.
- cmap : str or
Colormap, optional
A Colormap instance or registered colormap name. The colormap
maps the C values to colors. Defaults to rcParams["image.cmap"].
- norm :
Normalize, optional
The Normalize instance scales the data values to the canonical
colormap range [0, 1] for mapping to colors. By default, the data
range is mapped to the colorbar range using linear scaling.
- vmin, vmax : scalar, optional, default: None
The colorbar range. If None, suitable min/max values are
automatically chosen by the Normalize instance (defaults to
the respective min/max values of C in case of the default linear
scaling).
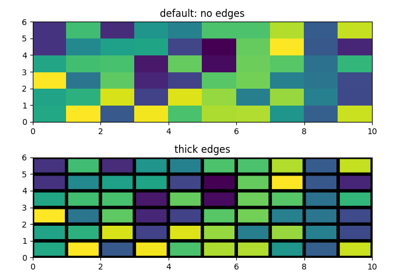
- edgecolors : {'none', None, 'face', color, color sequence}, optional
The color of the edges. Defaults to 'none'. Possible values:
- 'none' or '': No edge.
- None:
rcParams["patch.edgecolor"] will be used. Note that currently
rcParams["patch.force_edgecolor"] has to be True for this to work.
- 'face': Use the adjacent face color.
- An mpl color or sequence of colors will set the edge color.
The singular form edgecolor works as an alias.
- alpha : scalar, optional, default: None
The alpha blending value of the face color, between 0 (transparent)
and 1 (opaque). Note: The edgecolor is currently not affected by
this.
- snap : bool, optional, default: False
Whether to snap the mesh to pixel boundaries.
|
|---|
| Other Parameters: |
- antialiaseds : bool, optional, default: False
The default antialiaseds is False if the default
edgecolors="none" is used. This eliminates artificial lines
at patch boundaries, and works regardless of the value of alpha.
If edgecolors is not "none", then the default antialiaseds
is taken from rcParams["patch.antialiased"], which defaults to True.
Stroking the edges may be preferred if alpha is 1, but will
cause artifacts otherwise.
- **kwargs :
Additionally, the following arguments are allowed. They are passed
along to the PolyCollection constructor:
| Property |
Description |
|---|
agg_filter |
a filter function, which takes a (m, n, 3) float array and a dpi value, and returns a (m, n, 3) array |
alpha |
float or None |
animated |
bool |
antialiased or antialiaseds |
Boolean or sequence of booleans |
array |
ndarray |
capstyle |
unknown |
clim |
a length 2 sequence of floats; may be overridden in methods that have vmin and vmax kwargs. |
clip_box |
a Bbox instance |
clip_on |
bool |
clip_path |
[(Path, Transform) | Patch | None] |
cmap |
a colormap or registered colormap name |
color |
matplotlib color arg or sequence of rgba tuples |
contains |
a callable function |
edgecolor or edgecolors |
matplotlib color spec or sequence of specs |
facecolor or facecolors |
matplotlib color spec or sequence of specs |
figure |
a Figure instance |
gid |
an id string |
hatch |
[ '/' | '\' | '|' | '-' | '+' | 'x' | 'o' | 'O' | '.' | '*' ] |
joinstyle |
unknown |
label |
object |
linestyle or dashes or linestyles |
['solid' | 'dashed', 'dashdot', 'dotted' | (offset, on-off-dash-seq) | '-' | '--' | '-.' | ':' | 'None' | ' ' | ''] |
linewidth or linewidths or lw |
float or sequence of floats |
norm |
Normalize |
offset_position |
[ 'screen' | 'data' ] |
offsets |
float or sequence of floats |
path_effects |
AbstractPathEffect |
picker |
[None | bool | float | callable] |
pickradius |
float distance in points |
rasterized |
bool or None |
sketch_params |
(scale: float, length: float, randomness: float) |
snap |
bool or None |
transform |
Transform |
url |
a url string |
urls |
List[str] or None |
visible |
bool |
zorder |
float |
|
|---|