| Parameters: |
- Z : sparse array (n, m)
The array to be plotted.
- precision : float, optional, default: 0
If precision is 0, any non-zero value will be plotted; else,
values of \(|Z| > precision\) will be plotted.
For scipy.sparse.spmatrix instances, there is a special
case: if precision is 'present', any value present in the array
will be plotted, even if it is identically zero.
- origin : ["upper", "lower"], optional, default: "upper"
Place the [0,0] index of the array in the upper left or lower left
corner of the axes.
- aspect : ['auto' | 'equal' | scalar], optional, default: "equal"
If 'equal', and extent is None, changes the axes aspect ratio to
match that of the image. If extent is not None, the axes
aspect ratio is changed to match that of the extent.
If 'auto', changes the image aspect ratio to match that of the
axes.
If None, default to rc image.aspect value.
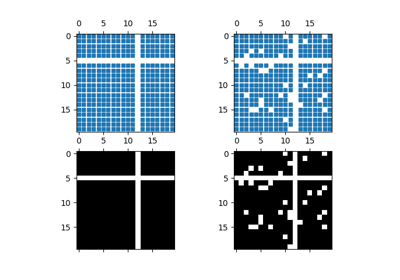
- Two plotting styles are available: image or marker. Both
- are available for full arrays, but only the marker style
- works for :class:`scipy.sparse.spmatrix` instances.
- If *marker* and *markersize* are *None*, an image will be
- returned and any remaining kwargs are passed to
- :func:`~matplotlib.pyplot.imshow`; else, a
- :class:`~matplotlib.lines.Line2D` object will be returned with
- the value of marker determining the marker type, and any
- remaining kwargs passed to the
- :meth:`~matplotlib.axes.Axes.plot` method.
- If *marker* and *markersize* are *None*, useful kwargs include:
- * *cmap*
- * *alpha*
|
|---|