Version 2.2.4
Note
Click here to download the full example code
import matplotlib.pyplot as plt
import matplotlib.gridspec as gridspec
def make_ticklabels_invisible(fig):
for i, ax in enumerate(fig.axes):
ax.text(0.5, 0.5, "ax%d" % (i+1), va="center", ha="center")
ax.tick_params(labelbottom=False, labelleft=False)
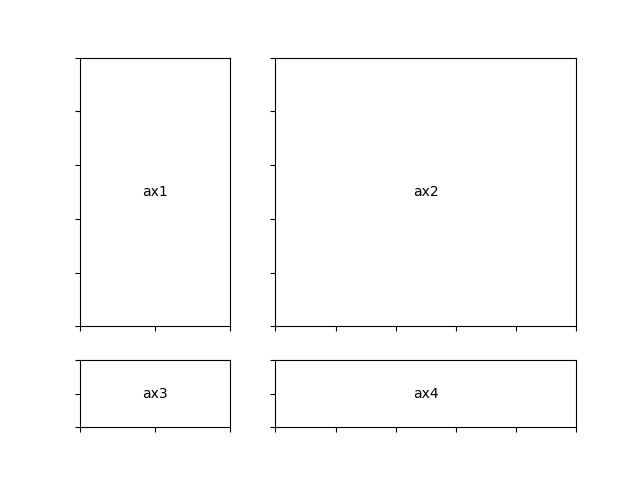
f = plt.figure()
gs = gridspec.GridSpec(2, 2,
width_ratios=[1, 2], height_ratios=[4, 1])
ax1 = plt.subplot(gs[0])
ax2 = plt.subplot(gs[1])
ax3 = plt.subplot(gs[2])
ax4 = plt.subplot(gs[3])
make_ticklabels_invisible(f)
plt.show()
Keywords: matplotlib code example, codex, python plot, pyplot Gallery generated by Sphinx-Gallery