Version 2.2.4
Note
Click here to download the full example code
import matplotlib.pyplot as plt
from matplotlib.gridspec import GridSpec
def make_ticklabels_invisible(fig):
for i, ax in enumerate(fig.axes):
ax.text(0.5, 0.5, "ax%d" % (i+1), va="center", ha="center")
ax.tick_params(labelbottom=False, labelleft=False)
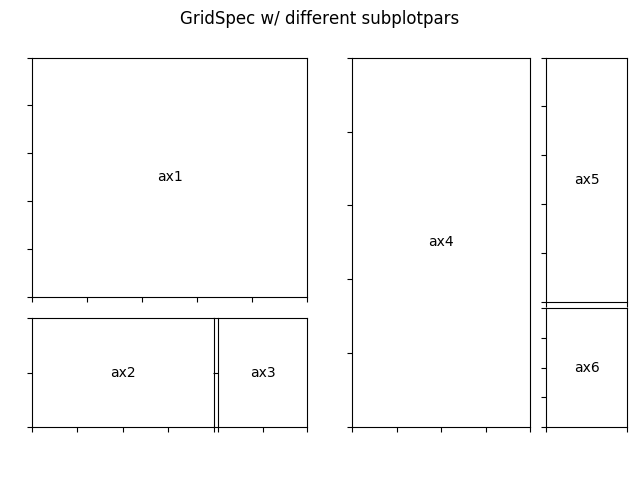
# demo 3 : gridspec with subplotpars set.
fig = plt.figure()
fig.suptitle("GridSpec w/ different subplotpars")
gs1 = GridSpec(3, 3)
gs1.update(left=0.05, right=0.48, wspace=0.05)
ax1 = plt.subplot(gs1[:-1, :])
ax2 = plt.subplot(gs1[-1, :-1])
ax3 = plt.subplot(gs1[-1, -1])
gs2 = GridSpec(3, 3)
gs2.update(left=0.55, right=0.98, hspace=0.05)
ax4 = plt.subplot(gs2[:, :-1])
ax5 = plt.subplot(gs2[:-1, -1])
ax6 = plt.subplot(gs2[-1, -1])
make_ticklabels_invisible(fig)
plt.show()
Keywords: matplotlib code example, codex, python plot, pyplot Gallery generated by Sphinx-Gallery