Version 2.2.4
Note
Click here to download the full example code
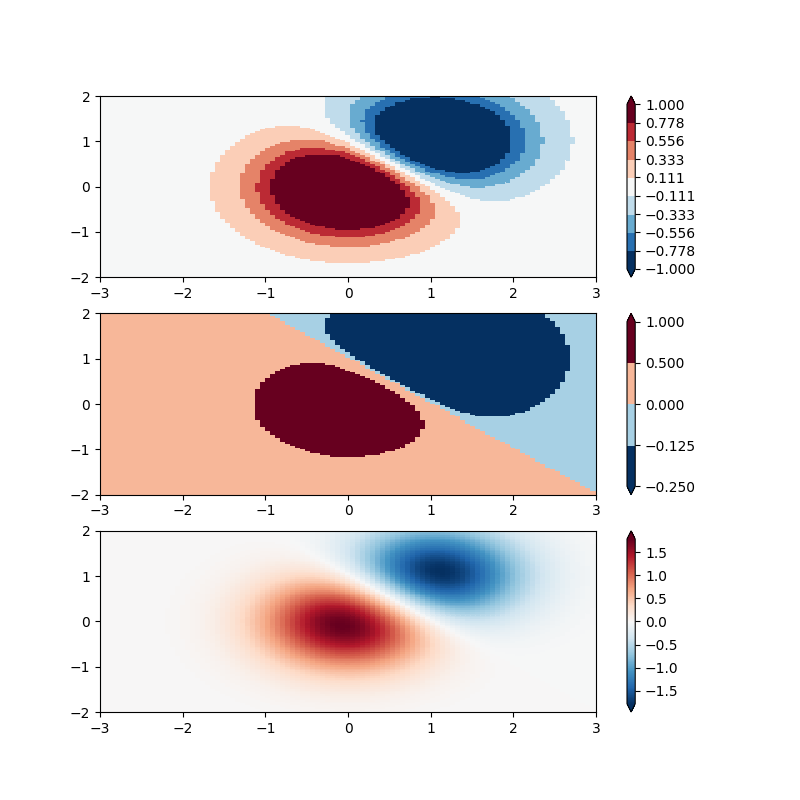
Demonstration of using norm to map colormaps onto data in non-linear ways.
import numpy as np
import matplotlib.pyplot as plt
import matplotlib.colors as colors

N = 100
X, Y = np.mgrid[-3:3:complex(0, N), -2:2:complex(0, N)]
Z1 = np.exp(-X**2 - Y**2)
Z2 = np.exp(-(X - 1)**2 - (Y - 1)**2)
Z = (Z1 - Z2) * 2

'''
BoundaryNorm: For this one you provide the boundaries for your colors,
and the Norm puts the first color in between the first pair, the
second color between the second pair, etc.
'''

fig, ax = plt.subplots(3, 1, figsize=(8, 8))
ax = ax.flatten()
# even bounds gives a contour-like effect
bounds = np.linspace(-1, 1, 10)
norm = colors.BoundaryNorm(boundaries=bounds, ncolors=256)
pcm = ax[0].pcolormesh(X, Y, Z,
                       norm=norm,
                       cmap='RdBu_r')
fig.colorbar(pcm, ax=ax[0], extend='both', orientation='vertical')

# uneven bounds changes the colormapping:
bounds = np.array([-0.25, -0.125, 0, 0.5, 1])
norm = colors.BoundaryNorm(boundaries=bounds, ncolors=256)
pcm = ax[1].pcolormesh(X, Y, Z, norm=norm, cmap='RdBu_r')
fig.colorbar(pcm, ax=ax[1], extend='both', orientation='vertical')

pcm = ax[2].pcolormesh(X, Y, Z, cmap='RdBu_r', vmin=-np.max(Z))
fig.colorbar(pcm, ax=ax[2], extend='both', orientation='vertical')

plt.show()
Keywords: matplotlib code example, codex, python plot, pyplot Gallery generated by Sphinx-Gallery