Version 2.2.4
Note
Click here to download the full example code
The new ticker code was designed to explicitly support user customized ticking. The documentation http://matplotlib.org/api/ticker_api.html#module-matplotlib.ticker details this process. That code defines a lot of preset tickers but was primarily designed to be user extensible.
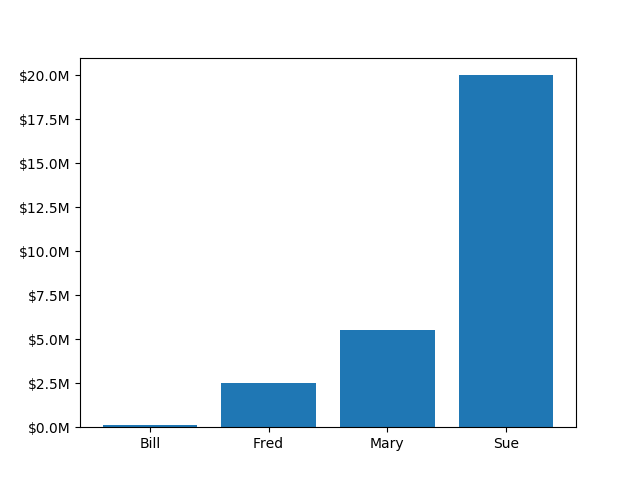
In this example a user defined function is used to format the ticks in millions of dollars on the y axis
from matplotlib.ticker import FuncFormatter
import matplotlib.pyplot as plt
import numpy as np

x = np.arange(4)
money = [1.5e5, 2.5e6, 5.5e6, 2.0e7]


def millions(x, pos):
    'The two args are the value and tick position'
    return '$%1.1fM' % (x * 1e-6)


formatter = FuncFormatter(millions)

fig, ax = plt.subplots()
ax.yaxis.set_major_formatter(formatter)
plt.bar(x, money)
plt.xticks(x, ('Bill', 'Fred', 'Mary', 'Sue'))
plt.show()
Keywords: matplotlib code example, codex, python plot, pyplot Gallery generated by Sphinx-Gallery