Version 2.2.4
Note
Click here to download the full example code
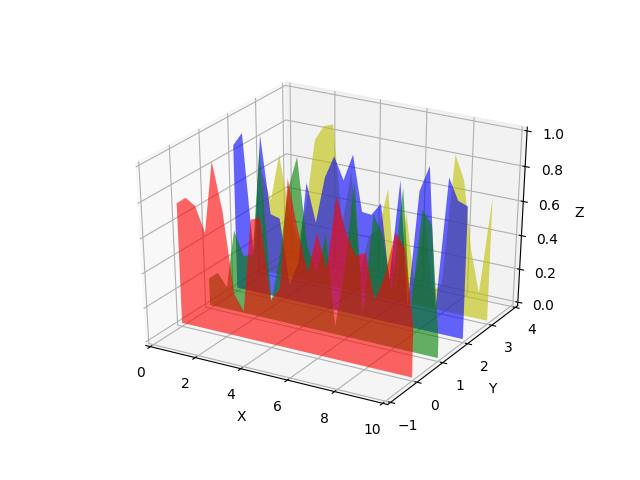
Demonstrate how to create polygons which fill the space under a line graph. In this example polygons are semi-transparent, creating a sort of 'jagged stained glass' effect.
from mpl_toolkits.mplot3d import Axes3D
from matplotlib.collections import PolyCollection
import matplotlib.pyplot as plt
from matplotlib import colors as mcolors
import numpy as np

# Fixing random state for reproducibility
np.random.seed(19680801)


def cc(arg):
    '''
    Shorthand to convert 'named' colors to rgba format at 60% opacity.
    '''
    return mcolors.to_rgba(arg, alpha=0.6)


def polygon_under_graph(xlist, ylist):
    '''
    Construct the vertex list which defines the polygon filling the space under
    the (xlist, ylist) line graph.  Assumes the xs are in ascending order.
    '''
    return [(xlist[0], 0.)] + list(zip(xlist, ylist)) + [(xlist[-1], 0.)]


fig = plt.figure()
ax = fig.gca(projection='3d')

# Make verts a list, verts[i] will be a list of (x,y) pairs defining polygon i
verts = []

# Set up the x sequence
xs = np.linspace(0., 10., 26)

# The ith polygon will appear on the plane y = zs[i]
zs = range(4)

for i in zs:
    ys = np.random.rand(len(xs))
    verts.append(polygon_under_graph(xs, ys))

poly = PolyCollection(verts, facecolors=[cc('r'), cc('g'), cc('b'), cc('y')])
ax.add_collection3d(poly, zs=zs, zdir='y')

ax.set_xlabel('X')
ax.set_ylabel('Y')
ax.set_zlabel('Z')
ax.set_xlim(0, 10)
ax.set_ylim(-1, 4)
ax.set_zlim(0, 1)

plt.show()
Keywords: matplotlib code example, codex, python plot, pyplot Gallery generated by Sphinx-Gallery