Version 2.2.4
Note
Click here to download the full example code
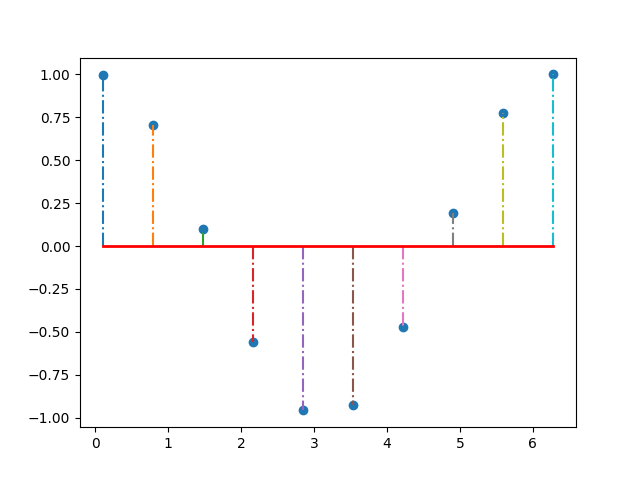
Stem plot plots vertical lines from baseline to the y-coordinate Plotting cosine(x) w.r.t x, using '-.' as the pattern for plotting vertical lines
import matplotlib.pyplot as plt
import numpy as np

# returns 10 evenly spaced samples from 0.1 to 2*PI
x = np.linspace(0.1, 2 * np.pi, 10)

markerline, stemlines, baseline = plt.stem(x, np.cos(x), '-.')

# setting property of baseline with color red and linewidth 2
plt.setp(baseline, color='r', linewidth=2)

plt.show()
This example makes use of:
* matplotlib.axes.Axes.stem()
Keywords: matplotlib code example, codex, python plot, pyplot Gallery generated by Sphinx-Gallery