Version 2.2.4
Note
Click here to download the full example code
Illustration of upper and lower limit symbols on errorbars
import numpy as np
import matplotlib.pyplot as plt
fig = plt.figure(0)
x = np.arange(10.0)
y = np.sin(np.arange(10.0) / 20.0 * np.pi)

plt.errorbar(x, y, yerr=0.1)

y = np.sin(np.arange(10.0) / 20.0 * np.pi) + 1
plt.errorbar(x, y, yerr=0.1, uplims=True)

y = np.sin(np.arange(10.0) / 20.0 * np.pi) + 2
upperlimits = np.array([1, 0] * 5)
lowerlimits = np.array([0, 1] * 5)
plt.errorbar(x, y, yerr=0.1, uplims=upperlimits, lolims=lowerlimits)

plt.xlim(-1, 10)
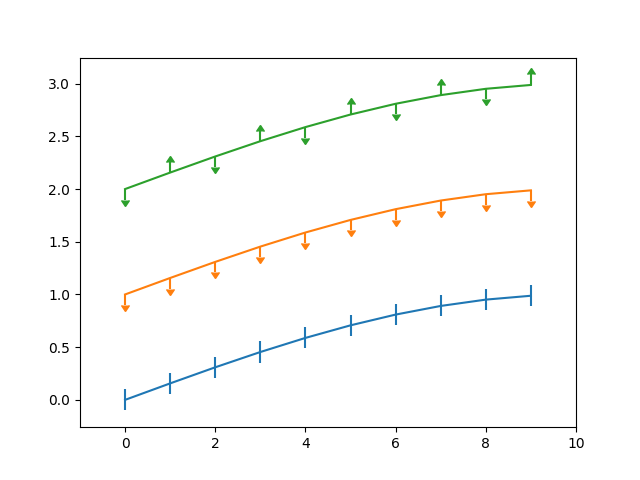
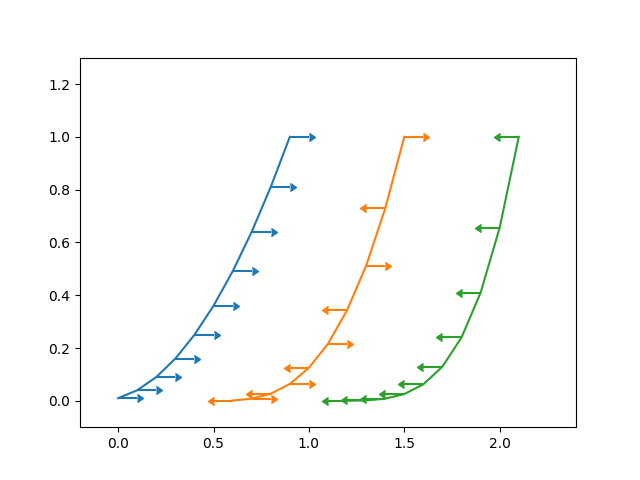
fig = plt.figure(1)
x = np.arange(10.0) / 10.0
y = (x + 0.1)**2

plt.errorbar(x, y, xerr=0.1, xlolims=True)
y = (x + 0.1)**3

plt.errorbar(x + 0.6, y, xerr=0.1, xuplims=upperlimits, xlolims=lowerlimits)

y = (x + 0.1)**4
plt.errorbar(x + 1.2, y, xerr=0.1, xuplims=True)

plt.xlim(-0.2, 2.4)
plt.ylim(-0.1, 1.3)

plt.show()
Keywords: matplotlib code example, codex, python plot, pyplot Gallery generated by Sphinx-Gallery