Version 2.2.4
Note
Click here to download the full example code
import matplotlib.pyplot as plt
from mpl_toolkits.axes_grid1 import AxesGrid
def get_demo_image():
import numpy as np
from matplotlib.cbook import get_sample_data
f = get_sample_data("axes_grid/bivariate_normal.npy", asfileobj=False)
z = np.load(f)
# z is a numpy array of 15x15
return z, (-3, 4, -4, 3)
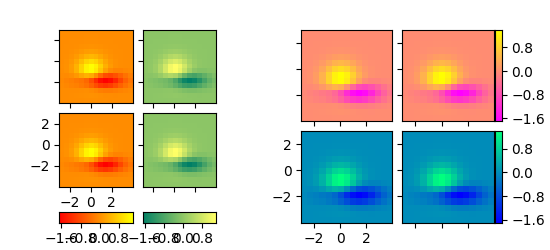
def demo_bottom_cbar(fig):
"""
A grid of 2x2 images with a colorbar for each column.
"""
grid = AxesGrid(fig, 121, # similar to subplot(132)
nrows_ncols=(2, 2),
axes_pad=0.10,
share_all=True,
label_mode="1",
cbar_location="bottom",
cbar_mode="edge",
cbar_pad=0.25,
cbar_size="15%",
direction="column"
)
Z, extent = get_demo_image()
cmaps = [plt.get_cmap("autumn"), plt.get_cmap("summer")]
for i in range(4):
im = grid[i].imshow(Z, extent=extent, interpolation="nearest",
cmap=cmaps[i//2])
if i % 2:
cbar = grid.cbar_axes[i//2].colorbar(im)
for cax in grid.cbar_axes:
cax.toggle_label(True)
cax.axis[cax.orientation].set_label("Bar")
# This affects all axes as share_all = True.
grid.axes_llc.set_xticks([-2, 0, 2])
grid.axes_llc.set_yticks([-2, 0, 2])
def demo_right_cbar(fig):
"""
A grid of 2x2 images. Each row has its own colorbar.
"""
grid = AxesGrid(F, 122, # similar to subplot(122)
nrows_ncols=(2, 2),
axes_pad=0.10,
label_mode="1",
share_all=True,
cbar_location="right",
cbar_mode="edge",
cbar_size="7%",
cbar_pad="2%",
)
Z, extent = get_demo_image()
cmaps = [plt.get_cmap("spring"), plt.get_cmap("winter")]
for i in range(4):
im = grid[i].imshow(Z, extent=extent, interpolation="nearest",
cmap=cmaps[i//2])
if i % 2:
grid.cbar_axes[i//2].colorbar(im)
for cax in grid.cbar_axes:
cax.toggle_label(True)
cax.axis[cax.orientation].set_label('Foo')
# This affects all axes because we set share_all = True.
grid.axes_llc.set_xticks([-2, 0, 2])
grid.axes_llc.set_yticks([-2, 0, 2])
if 1:
F = plt.figure(1, (5.5, 2.5))
F.subplots_adjust(left=0.05, right=0.93)
demo_bottom_cbar(F)
demo_right_cbar(F)
plt.draw()
plt.show()
Keywords: matplotlib code example, codex, python plot, pyplot Gallery generated by Sphinx-Gallery