Version 2.2.4
Note
Click here to download the full example code
import matplotlib.pyplot as plt
from mpl_toolkits.axes_grid1.axes_divider import make_axes_locatable
from mpl_toolkits.axes_grid1.colorbar import colorbar
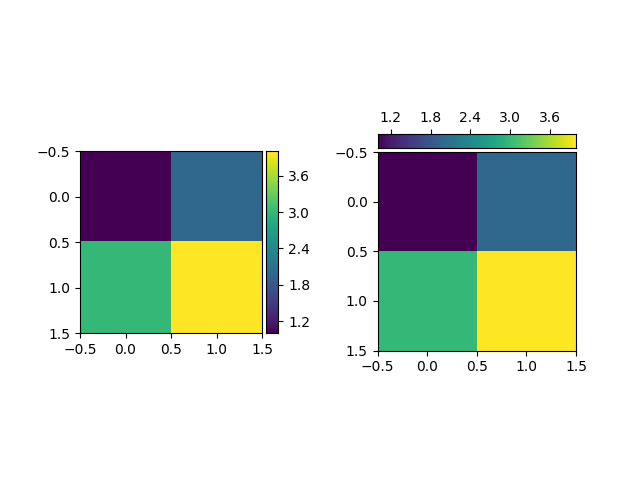
fig, (ax1, ax2) = plt.subplots(1, 2)
fig.subplots_adjust(wspace=0.5)
im1 = ax1.imshow([[1, 2], [3, 4]])
ax1_divider = make_axes_locatable(ax1)
cax1 = ax1_divider.append_axes("right", size="7%", pad="2%")
cb1 = colorbar(im1, cax=cax1)
im2 = ax2.imshow([[1, 2], [3, 4]])
ax2_divider = make_axes_locatable(ax2)
cax2 = ax2_divider.append_axes("top", size="7%", pad="2%")
cb2 = colorbar(im2, cax=cax2, orientation="horizontal")
cax2.xaxis.set_ticks_position("top")
plt.show()
Keywords: matplotlib code example, codex, python plot, pyplot Gallery generated by Sphinx-Gallery