Version 2.2.4
All documentation is built from the doc/ directory. This directory
contains both reStructuredText (ReST; .rst) files that contain pages in
the documentation and configuration files for Sphinx.
The .rst files are kept in doc/users,
doc/devel, doc/api and doc/faq. The main entry point is
doc/index.rst, which pulls in the index.rst file for the users
guide, developers guide, api reference, and FAQs. The documentation suite is
built as a single document in order to make the most effective use of cross
referencing.
Sphinx also creates .rst files that are staged in doc/api from
the docstrings of the classes in the Matplotlib library. Except for
doc/api/api_changes/, these .rst files are created when the
documentation is built.
Similarly, the contents of docs/gallery and docs/tutorials are
generated by the Sphinx Gallery from the sources in examples and
tutorials. These sources consist of python scripts that have ReST
documentation built into their comments. Don't directly edit the
.rst files in docs/gallery and docs/tutorials as they are
regenerated when the documentation are built.
The documentation for Matplotlib is generated from reStructuredText (ReST)
using the Sphinx documentation generation tool. There are several extra
requirements that are needed to build the documentation. They are listed in
doc-requirements.txt and listed below:
Note
The documentation sources are found in the doc/ directory in the trunk.
The configuration file for Sphinx is doc/conf.py. It controls which
directories Sphinx parses, how the docs are built, and how the extensions are
used. To build the documentation in html format, cd into doc/ and run:
make html
Other useful invocations include
# Delete built files.  May help if you get errors about missing paths or
# broken links.
make clean

# Build pdf docs.
make latexpdf
The SPHINXOPTS variable is set to -W by default to turn warnings into
errors. To unset it, use
make SPHINXOPTS= html
You can use the O variable to set additional options:
make O=-j4 html runs a parallel build with 4 processes.make O=-Dplot_formats=png:100 html saves figures in low resolution.make O=-Dplot_gallery=0 html skips the gallery build.Multiple options can be combined using e.g. make O='-j4 -Dplot_gallery=0'
html.
On Windows, options needs to be set as environment variables, e.g. set O=-W
-j4 & make html.
Most documentation is either in the docstring of individual
classes and methods, in explicit .rst files, or in examples and tutorials.
All of these use the ReST syntax. Users should look at the ReST documentation
for a full description. But some specific hints and conventions Matplotlib
uses are useful for creating documentation.
It is useful to strive for consistency in the Matplotlib documentation. Here are some formatting and style conventions that are used.
For everything but top-level chapters, use Upper lower for
section titles, e.g., Possible hangups rather than Possible
Hangups
Function arguments and keywords within docstrings should be referred to using
the *emphasis* role. This will keep Matplotlib's documentation consistent
with Python's documentation:
Here is a description of *argument*
Do not use the `default role`:
Do not describe `argument` like this.  As per the next section,
this syntax will (unsuccessfully) attempt to resolve the argument as a
link to a class or method in the library.
nor the ``literal`` role:
Do not describe ``argument`` like this.
Sphinx allows internal references between documents.
Documents can be linked with the :doc: directive:
See the :doc:`/faq/installing_faq`

See the tutorial :doc:`/tutorials/introductory/sample_plots`

See the example :doc:`/gallery/lines_bars_and_markers/simple_plot`
will render as:
Sections can also be given reference names. For instance from the Installation link:
.. _clean-install:

How to completely remove Matplotlib
===================================

Occasionally, problems with Matplotlib can be solved with a clean...
and refer to it using the standard reference syntax:
See :ref:`clean-install`
will give the following link: How to completely remove Matplotlib
To maximize internal consistency in section labeling and references,
use hyphen separated, descriptive labels for section references.
Keep in mind that contents may be reorganized later, so
avoid top level names in references like user or devel
or faq unless necessary, because for example the FAQ "what is a
backend?" could later become part of the users guide, so the label:
.. _what-is-a-backend:
is better than:
.. _faq-backend:
In addition, since underscores are widely used by Sphinx itself, use hyphens to separate words.
To link to other methods, classes, or modules in Matplotlib you can use back ticks, for example:
`~matplotlib.collections.LineCollection`
returns a link to the documentation of
LineCollection. For the full path of the
class to be shown, omit the tilde:
`matplotlib.collections.LineCollection`
to get matplotlib.collections.LineCollection. It is often not
necessary to fully specify the class hierarchy unless there is a namespace
collision between two packages:
`~.LineCollection`
links just as well: LineCollection.
Other packages can also be linked via intersphinx:
`numpy.mean`
will return this link: numpy.mean. This works for Python, Numpy, Scipy,
and Pandas (full list is in doc/conf.py). Sometimes it is tricky
to get external Sphinx linking to work; to
check that a something exists to link to the following shell command outputs
a list of all objects that can be referenced (in this case for Numpy):
python -m sphinx.ext.intersphinx 'https://docs.scipy.org/doc/numpy/objects.inv'
Image files can directly included in pages with the image:: directive.
e.g., users/navigation_toolbar.rst displays the toolbar icons
with a call to a static image:
.. image:: ../_static/toolbar.png
as rendered on the page: Interactive navigation.
Files can be included verbatim. For instance the matplotlibrc file
is important for customizing Matplotlib, and is included verbatim in the
tutorial in Customizing Matplotlib with style sheets and rcParams:
.. literalinclude:: ../../_static/matplotlibrc
This is rendered at the bottom of Customizing Matplotlib with style sheets and rcParams. Note that this is in a tutorial; see Writing examples and tutorials below.
The examples directory is also copied to doc/gallery by sphinx-gallery,
so plots from the examples directory can be included using
.. plot:: gallery/pylab_examples/simple_plot.py
Note that the python script that generates the plot is referred to, rather than any plot that is created. Sphinx-gallery will provide the correct reference when the documentation is built.
Much of the documentation lives in "docstrings". These are comment blocks
in source code that explain how the code works. All new or edited docstrings
should conform to the numpydoc guidelines. These split the docstring into a
number of sections - see the numpy documentation howto
for more details and a guide to how docstrings should be formatted. Much of
the ReST syntax discussed above (:ref:writing-rest-pages) can be used for
links and references. These docstrings eventually populate the
doc/api directory and form the reference documentation for the
library.
An example docstring looks like:
def hlines(self, y, xmin, xmax, colors='k', linestyles='solid',
           label='', **kwargs):
      """
      Plot horizontal lines at each *y* from *xmin* to *xmax*.

      Parameters
      ----------
      y : scalar or sequence of scalar
          y-indexes where to plot the lines.

      xmin, xmax : scalar or 1D array_like
          Respective beginning and end of each line. If scalars are
          provided, all lines will have same length.

      colors : array_like of colors, optional, default: 'k'

      linestyles : {'solid', 'dashed', 'dashdot', 'dotted'}, optional

      label : string, optional, default: ''

      Returns
      -------
      lines : `~matplotlib.collections.LineCollection`

      Other Parameters
      ----------------
      **kwargs : `~matplotlib.collections.LineCollection` properties.

      See also
      --------
      vlines : vertical lines
      axhline: horizontal line across the axes
      """
See the hlines documentation for how this renders.
The Sphinx website also contains plenty of documentation concerning ReST markup and working with Sphinx in general.
Note
Some parts of the documentation do not yet conform to the current documentation style. If in doubt, follow the rules given here and not what you may see in the source code. Pull requests updating docstrings to the current style are very welcome.
The basic docstring conventions are covered in the numpy documentation howto and the Sphinx documentation. Some Matplotlib-specific formatting conventions to keep in mind:
Matplotlib does not have a convention whether to use single-quotes or double-quotes. There is a mixture of both in the current code.
Long parameter lists should be wrapped using a \ for continuation and
starting on the new line without any indent:
def add_axes(self, *args, **kwargs):
    """
    ...

    Parameters
    ----------
    projection :
        {'aitoff', 'hammer', 'lambert', 'mollweide', 'polar', \
'rectilinear'}, optional
        The projection type of the axes.

    ...
    """
Alternatively, you can describe the valid parameter values in a dedicated section of the docstring.
Generally, do not add markup to types for Parameters and Returns.
This is usually not needed because Sphinx will link them automatically and
would unnecessarily clutter the docstring. However, it does seem to fail in
some situations. If you encounter such a case, you are allowed to add markup:
Returns
-------
lines : `~matplotlib.collections.LineCollection`
rcParams can be referenced with the custom :rc: role:
:rc:`foo` yields rcParams["foo"].
['solid' | 'dashed' | 'dotted']. With numpydoc we have switched to their
standard using curly braces {'solid', 'dashed', 'dotted'}.To link to other methods, classes, or modules in Matplotlib you can encase the name to refer to in back ticks, for example:
`~matplotlib.collections.LineCollection`
It is also possible to add links to code in Python, Numpy, Scipy, or Pandas. Sometimes it is tricky to get external Sphinx linking to work; to check that a something exists to link to the following shell command outputs a list of all objects that can be referenced (in this case for Numpy):
python -m sphinx.ext.intersphinx 'https://docs.scipy.org/doc/numpy/objects.inv'
Function arguments and keywords within docstrings should be referred to using
the *emphasis* role. This will keep Matplotlib's documentation consistent
with Python's documentation:
Here is a description of *argument*
Do not use the `default role`:
Do not describe `argument` like this.
nor the ``literal`` role:
Do not describe ``argument`` like this.
Artist properties are implemented using setter and getter methods (because
Matplotlib predates the introductions of the property decorator in Python).
By convention, these setters and getters are named set_PROPERTYNAME and
get_PROPERTYNAME; the list of properties thusly defined on an artist and
their values can be listed by the setp and getp functions.
Property setter methods should indicate the values they accept using a (legacy)
special block in the docstring, starting with ACCEPTS, as follows:
# in lines.py
def set_linestyle(self, linestyle):
    """
    Set the linestyle of the line

    ACCEPTS: [ '-' | '--' | '-.' | ':' | 'steps' | 'None' | ' ' | '' ]
    """
The ACCEPTS block is used to render a table of all properties and their
acceptable values in the docs; it can also be displayed using, e.g.,
plt.setp(Line2D) (all properties) or plt.setp(Line2D, 'linestyle')
(just one property).
There are cases in which the ACCEPTS string is not useful in the
generated Sphinx documentation, e.g. if the valid parameters are already
defined in the numpydoc parameter list. You can hide the ACCEPTS string from
Sphinx by making it a ReST comment (i.e. use .. ACCEPTS:):
def set_linestyle(self, linestyle):
    """
    An ACCEPTS string invisible to Sphinx.

    .. ACCEPTS: [ '-' | '--' | '-.' | ':' | 'steps' | 'None' | ' ' | '' ]
    """
Note
The information in this section is being actively discussed by the development team, so use the docstring interpolation only if necessary. This section has been left in place for now because this interpolation is part of the existing documentation.
Since Matplotlib uses a lot of pass-through kwargs, e.g., in every function
that creates a line (plot, semilogx, semilogy,
etc...), it can be difficult for the new user to know which kwargs are
supported. Matplotlib uses a docstring interpolation scheme to support
documentation of every function that takes a **kwargs. The requirements
are:
The function matplotlib.artist.kwdoc and the decorator
matplotlib.docstring.dedent_interpd facilitate this. They combine Python
string interpolation in the docstring with the Matplotlib artist introspection
facility that underlies setp and getp. The kwdoc function gives
the list of properties as a docstring. In order to use this in another
docstring, first update the matplotlib.docstring.interpd object, as seen in
this example from matplotlib.lines:
# in lines.py
docstring.interpd.update(Line2D=artist.kwdoc(Line2D))
Then in any function accepting Line2D pass-through kwargs, e.g.,
matplotlib.axes.Axes.plot:
# in axes.py
@docstring.dedent_interpd
def plot(self, *args, **kwargs):
    """
    Some stuff omitted

    The kwargs are Line2D properties:
    %(Line2D)s

    kwargs scalex and scaley, if defined, are passed on
    to autoscale_view to determine whether the x and y axes are
    autoscaled; default True.  See Axes.autoscale_view for more
    information
    """
Note there is a problem for Artist __init__ methods,
e.g., matplotlib.patches.Patch.__init__, which supports Patch kwargs,
since the artist inspector cannot work until the class is fully defined and
we can't modify the Patch.__init__.__doc__ docstring outside the class
definition. There are some some manual hacks in this case, violating the
"single entry point" requirement above -- see the docstring.interpd.update
calls in matplotlib.patches.
As above (see Including figures and files), figures in the examples gallery
can be referenced with a :plot: directive pointing to the python script that
created the figure. For instance the legend docstring references
the file examples/api/legend.py:
"""
 ...

Examples
--------

.. plot:: gallery/api/legend.py
"""
Note that examples/api/legend.py has been mapped to
gallery/api/legend.py, a redirection that may be fixed in future
re-organization of the docs.
Plots can also be directly placed inside docstrings. Details are in Plot directive documentation. A short example is:
"""
 ...

Examples
--------

.. plot::
   import matplotlib.image as mpimg
   img = mpimg.imread('_static/stinkbug.png')
   imgplot = plt.imshow(img)
"""
An advantage of this style over referencing an example script is that the code will also appear in interactive docstrings.
Examples and tutorials are python scripts that are run by Sphinx Gallery
to create a gallery of images in the /doc/gallery and
/doc/tutorials directories respectively. To exclude an example
from having an plot generated insert "sgskip" somewhere in the filename.
The format of these files is relatively straightforward. Properly formatted comment blocks are treated as ReST text, the code is displayed, and figures are put into the built page.
For instance the example Simple Plot
example is generated from
/examples/lines_bars_and_markers/simple_plot.py, which looks like:
"""
===========
Simple Plot
===========

Create a simple plot.
"""
import matplotlib.pyplot as plt
import numpy as np

# Data for plotting
t = np.arange(0.0, 2.0, 0.01)
s = 1 + np.sin(2 * np.pi * t)

# Note that using plt.subplots below is equivalent to using
# fig = plt.figure and then ax = fig.add_subplot(111)
fig, ax = plt.subplots()
ax.plot(t, s)

ax.set(xlabel='time (s)', ylabel='voltage (mV)',
       title='About as simple as it gets, folks')
ax.grid()
plt.show()
The first comment block is treated as ReST text. The other comment blocks render as comments in Simple Plot.
Tutorials are made with the exact same mechanism, except they are longer, and
typically have more than one comment block (i.e.
Usage Guide). The first comment block
can be the same as the example above. Subsequent blocks of ReST text
are delimited by a line of ### characters:
"""
===========
Simple Plot
===========

Create a simple plot.
"""
...
ax.grid()
plt.show()

##########################################################################
# Second plot
# ===========
#
# This is a second plot that is very nice

fig, ax = plt.subplots()
ax.plot(np.sin(range(50)))
In this way text, code, and figures are output in a "notebook" style.
There is a Matplotlib Google/Gmail account with username mplgithub
which was used to setup the github account but can be used for other
purposes, like hosting Google docs or Youtube videos. You can embed a
Matplotlib animation in the docs by first saving the animation as a
movie using matplotlib.animation.Animation.save(), and then
uploading to matplotlib's Youtube
channel and inserting the
embedding string youtube provides like:
.. raw:: html

   <iframe width="420" height="315"
     src="http://www.youtube.com/embed/32cjc6V0OZY"
     frameborder="0" allowfullscreen>
   </iframe>
An example save command to generate a movie looks like this
ani = animation.FuncAnimation(fig, animate, np.arange(1, len(y)),
    interval=25, blit=True, init_func=init)

ani.save('double_pendulum.mp4', fps=15)
Contact Michael Droettboom for the login password to upload youtube videos of google docs to the mplgithub account.
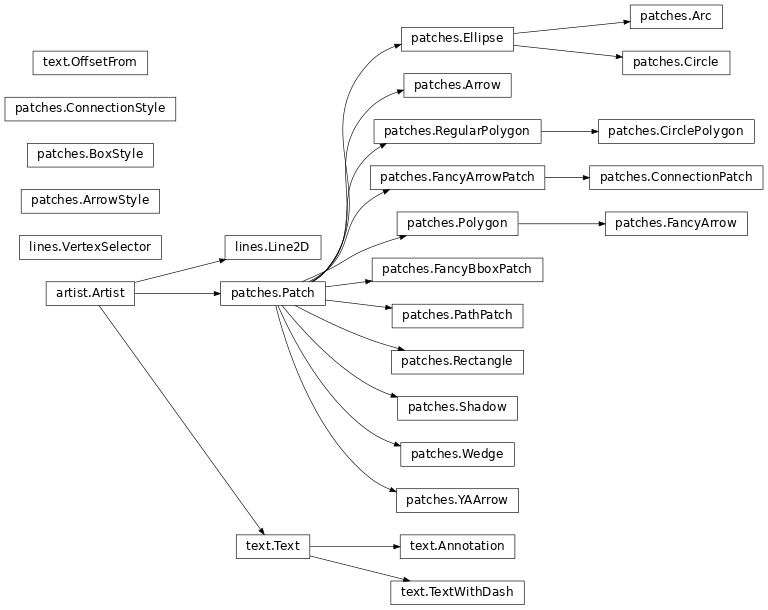
Class inheritance diagrams can be generated with the
inheritance-diagram directive. To use it, provide the
directive with a number of class or module names (separated by
whitespace). If a module name is provided, all classes in that module
will be used. All of the ancestors of these classes will be included
in the inheritance diagram.
A single option is available: parts controls how many of parts in
the path to the class are shown. For example, if parts == 1, the
class matplotlib.patches.Patch is shown as Patch. If parts
== 2, it is shown as patches.Patch. If parts == 0, the full
path is shown.
Example:
.. inheritance-diagram:: matplotlib.patches matplotlib.lines matplotlib.text
   :parts: 2
There is an emacs mode rst.el which
automates many important ReST tasks like building and updating
table-of-contents, and promoting or demoting section headings. Here
is the basic .emacs configuration:
(require 'rst)
(setq auto-mode-alist
      (append '(("\\.txt$" . rst-mode)
                ("\\.rst$" . rst-mode)
                ("\\.rest$" . rst-mode)) auto-mode-alist))
Some helpful functions:
C-c TAB - rst-toc-insert

  Insert table of contents at point

C-c C-u - rst-toc-update

    Update the table of contents at point

C-c C-l rst-shift-region-left

    Shift region to the left

C-c C-r rst-shift-region-right

    Shift region to the right