Axes
matplotlib.axes.Axes.set_ylabel
Axes.
set_ylabel
Set the label for the y-axis.
The label text.
Spacing in points between the label and the y-axis.
Text
Text properties control the appearance of the label.
See also
text
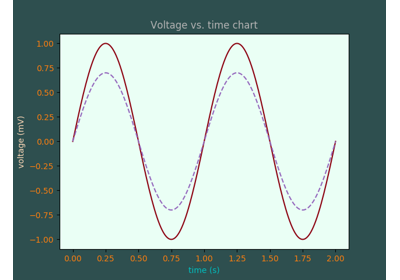
Color Demo
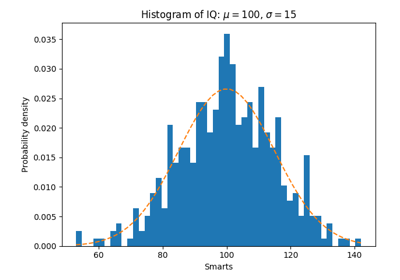
Demo of the histogram (hist) function with a few features