Version 2.2.3
Note
Click here to download the full example code
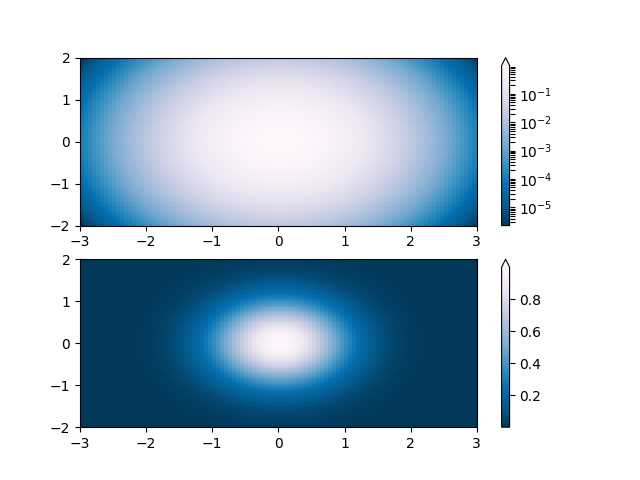
Demonstration of using norm to map colormaps onto data in non-linear ways.
import numpy as np
import matplotlib.pyplot as plt
import matplotlib.colors as colors

'''
Lognorm: Instead of pcolor log10(Z1) you can have colorbars that have
the exponential labels using a norm.
'''
N = 100
X, Y = np.mgrid[-3:3:complex(0, N), -2:2:complex(0, N)]

# A low hump with a spike coming out of the top right.  Needs to have
# z/colour axis on a log scale so we see both hump and spike.  linear
# scale only shows the spike.
Z = np.exp(-X**2 - Y**2)

fig, ax = plt.subplots(2, 1)

pcm = ax[0].pcolor(X, Y, Z,
                   norm=colors.LogNorm(vmin=Z.min(), vmax=Z.max()),
                   cmap='PuBu_r')
fig.colorbar(pcm, ax=ax[0], extend='max')

pcm = ax[1].pcolor(X, Y, Z, cmap='PuBu_r')
fig.colorbar(pcm, ax=ax[1], extend='max')

plt.show()
Keywords: matplotlib code example, codex, python plot, pyplot Gallery generated by Sphinx-Gallery