Version 2.2.3
Note
Click here to download the full example code
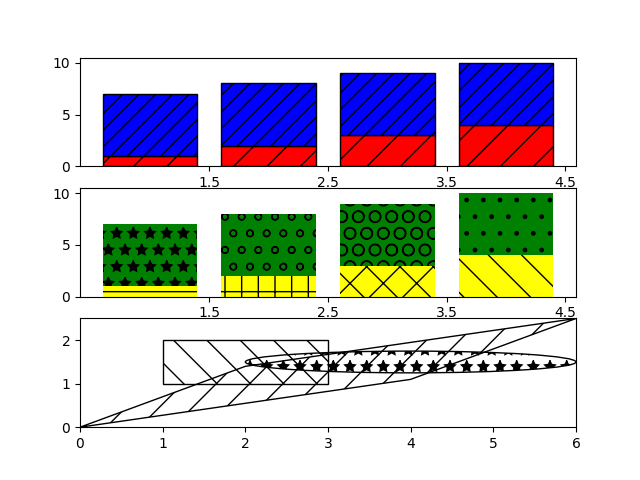
Hatching (pattern filled polygons) is supported currently in the PS, PDF, SVG and Agg backends only.
import matplotlib.pyplot as plt
from matplotlib.patches import Ellipse, Polygon

fig, (ax1, ax2, ax3) = plt.subplots(3)

ax1.bar(range(1, 5), range(1, 5), color='red', edgecolor='black', hatch="/")
ax1.bar(range(1, 5), [6] * 4, bottom=range(1, 5),
        color='blue', edgecolor='black', hatch='//')
ax1.set_xticks([1.5, 2.5, 3.5, 4.5])

bars = ax2.bar(range(1, 5), range(1, 5), color='yellow', ecolor='black') + \
    ax2.bar(range(1, 5), [6] * 4, bottom=range(1, 5),
            color='green', ecolor='black')
ax2.set_xticks([1.5, 2.5, 3.5, 4.5])

patterns = ('-', '+', 'x', '\\', '*', 'o', 'O', '.')
for bar, pattern in zip(bars, patterns):
    bar.set_hatch(pattern)

ax3.fill([1, 3, 3, 1], [1, 1, 2, 2], fill=False, hatch='\\')
ax3.add_patch(Ellipse((4, 1.5), 4, 0.5, fill=False, hatch='*'))
ax3.add_patch(Polygon([[0, 0], [4, 1.1], [6, 2.5], [2, 1.4]], closed=True,
                      fill=False, hatch='/'))
ax3.set_xlim((0, 6))
ax3.set_ylim((0, 2.5))

plt.show()
The use of the following functions, methods, classes and modules is shown in this example:
Keywords: matplotlib code example, codex, python plot, pyplot Gallery generated by Sphinx-Gallery