Version 2.2.3
Note
Click here to download the full example code
import numpy as np
import matplotlib.pyplot as plt
d = np.arange(100).reshape(10, 10)
x, y = np.meshgrid(np.arange(11), np.arange(11))
theta = 0.25*np.pi
xx = x*np.cos(theta) - y*np.sin(theta)
yy = x*np.sin(theta) + y*np.cos(theta)
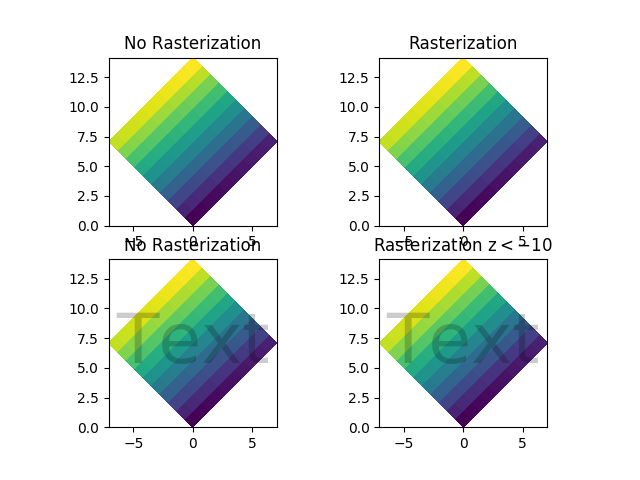
fig, ((ax1, ax2), (ax3, ax4)) = plt.subplots(2, 2)
ax1.set_aspect(1)
ax1.pcolormesh(xx, yy, d)
ax1.set_title("No Rasterization")
ax2.set_aspect(1)
ax2.set_title("Rasterization")
m = ax2.pcolormesh(xx, yy, d)
m.set_rasterized(True)
ax3.set_aspect(1)
ax3.pcolormesh(xx, yy, d)
ax3.text(0.5, 0.5, "Text", alpha=0.2,
va="center", ha="center", size=50, transform=ax3.transAxes)
ax3.set_title("No Rasterization")
ax4.set_aspect(1)
m = ax4.pcolormesh(xx, yy, d)
m.set_zorder(-20)
ax4.text(0.5, 0.5, "Text", alpha=0.2,
zorder=-15,
va="center", ha="center", size=50, transform=ax4.transAxes)
ax4.set_rasterization_zorder(-10)
ax4.set_title("Rasterization z$<-10$")
# ax2.title.set_rasterized(True) # should display a warning
plt.savefig("test_rasterization.pdf", dpi=150)
plt.savefig("test_rasterization.eps", dpi=150)
if not plt.rcParams["text.usetex"]:
plt.savefig("test_rasterization.svg", dpi=150)
# svg backend currently ignores the dpi
Keywords: matplotlib code example, codex, python plot, pyplot Gallery generated by Sphinx-Gallery