Version 2.2.3
Note
Click here to download the full example code
import matplotlib.pyplot as plt
from mpl_toolkits.axes_grid1.axes_rgb import RGBAxes
def get_demo_image():
import numpy as np
from matplotlib.cbook import get_sample_data
f = get_sample_data("axes_grid/bivariate_normal.npy", asfileobj=False)
z = np.load(f)
# z is a numpy array of 15x15
return z, (-3, 4, -4, 3)
def get_rgb():
Z, extent = get_demo_image()
Z[Z < 0] = 0.
Z = Z / Z.max()
R = Z[:13, :13]
G = Z[2:, 2:]
B = Z[:13, 2:]
return R, G, B
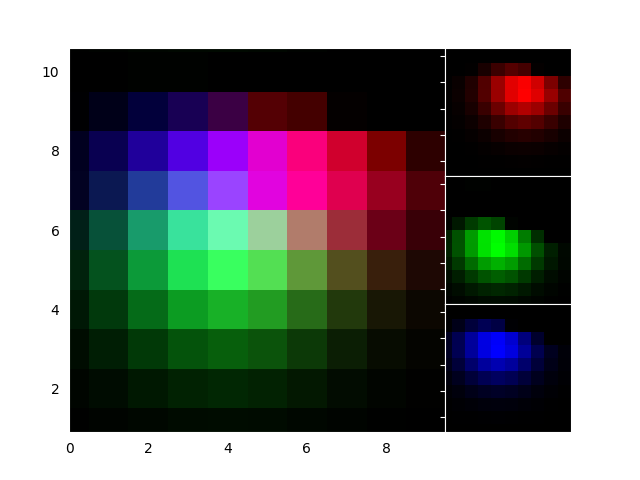
fig = plt.figure(1)
ax = RGBAxes(fig, [0.1, 0.1, 0.8, 0.8])
r, g, b = get_rgb()
kwargs = dict(origin="lower", interpolation="nearest")
ax.imshow_rgb(r, g, b, **kwargs)
ax.RGB.set_xlim(0., 9.5)
ax.RGB.set_ylim(0.9, 10.6)
plt.show()
Keywords: matplotlib code example, codex, python plot, pyplot Gallery generated by Sphinx-Gallery