Version 2.2.3
Note
Click here to download the full example code
import matplotlib.pyplot as plt
from mpl_toolkits.axes_grid1 import make_axes_locatable
import numpy as np
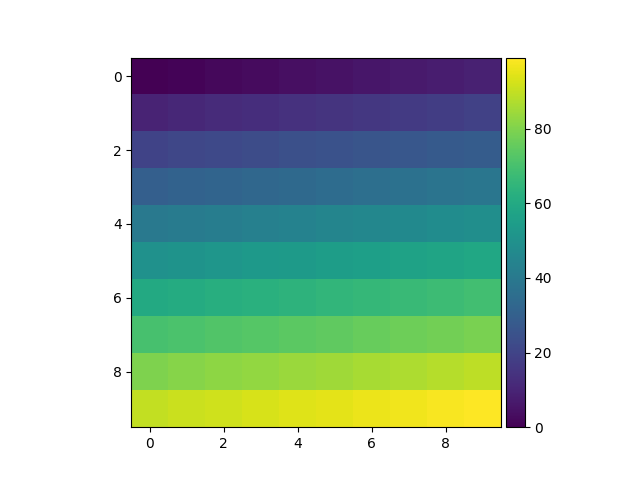
ax = plt.subplot(111)
im = ax.imshow(np.arange(100).reshape((10, 10)))
# create an axes on the right side of ax. The width of cax will be 5%
# of ax and the padding between cax and ax will be fixed at 0.05 inch.
divider = make_axes_locatable(ax)
cax = divider.append_axes("right", size="5%", pad=0.05)
plt.colorbar(im, cax=cax)
Keywords: matplotlib code example, codex, python plot, pyplot Gallery generated by Sphinx-Gallery