Version 2.2.3
matplotlib.pyplot.rc(*args, **kwargs)[source]¶Set the current rc params. Group is the grouping for the rc, e.g.,
for lines.linewidth the group is lines, for
axes.facecolor, the group is axes, and so on. Group may
also be a list or tuple of group names, e.g., (xtick, ytick).
kwargs is a dictionary attribute name/value pairs, e.g.,:
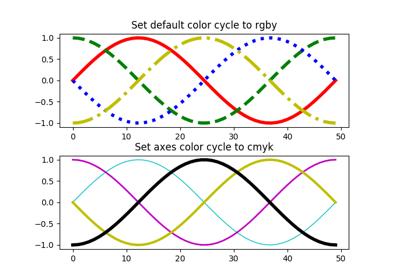
rc('lines', linewidth=2, color='r')
sets the current rc params and is equivalent to:
rcParams['lines.linewidth'] = 2
rcParams['lines.color'] = 'r'
The following aliases are available to save typing for interactive users:
| Alias | Property |
|---|---|
| 'lw' | 'linewidth' |
| 'ls' | 'linestyle' |
| 'c' | 'color' |
| 'fc' | 'facecolor' |
| 'ec' | 'edgecolor' |
| 'mew' | 'markeredgewidth' |
| 'aa' | 'antialiased' |
Thus you could abbreviate the above rc command as:
rc('lines', lw=2, c='r')
Note you can use python's kwargs dictionary facility to store dictionaries of default parameters. e.g., you can customize the font rc as follows:
font = {'family' : 'monospace',
        'weight' : 'bold',
        'size'   : 'larger'}

rc('font', **font)  # pass in the font dict as kwargs
This enables you to easily switch between several configurations. Use
matplotlib.style.use('default') or rcdefaults() to
restore the default rc params after changes.
matplotlib.pyplot.rc