Version 2.2.2
Note
Click here to download the full example code
Use Matplotlib’s internal LaTeX parser and layout engine. For true LaTeX rendering, see the text.usetex option.
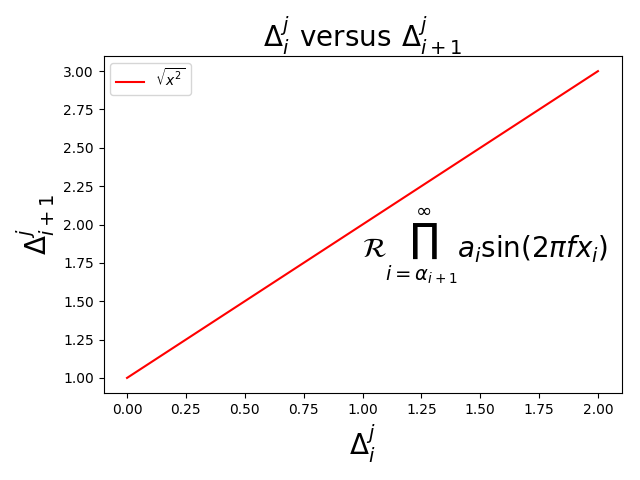
import matplotlib.pyplot as plt

fig, ax = plt.subplots()

ax.plot([1, 2, 3], 'r', label=r'$\sqrt{x^2}$')
ax.legend()

ax.set_xlabel(r'$\Delta_i^j$', fontsize=20)
ax.set_ylabel(r'$\Delta_{i+1}^j$', fontsize=20)
ax.set_title(r'$\Delta_i^j \hspace{0.4} \mathrm{versus} \hspace{0.4} '
             r'\Delta_{i+1}^j$', fontsize=20)

tex = r'$\mathcal{R}\prod_{i=\alpha_{i+1}}^\infty a_i\sin(2 \pi f x_i)$'
ax.text(1, 1.6, tex, fontsize=20, va='bottom')

fig.tight_layout()
plt.show()
Keywords: matplotlib code example, codex, python plot, pyplot Gallery generated by Sphinx-Gallery