Version 2.2.2
Note
Click here to download the full example code
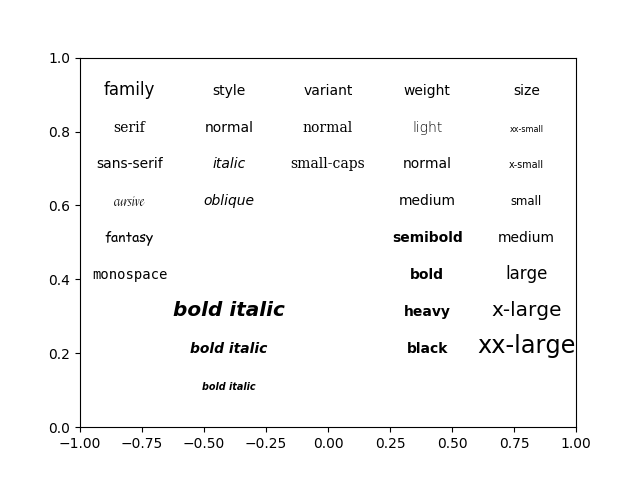
Set font properties using kwargs.
See Fonts demo (object-oriented style) to achieve the same effect using setters.
from matplotlib.font_manager import FontProperties
import matplotlib.pyplot as plt
import numpy as np

plt.subplot(111, facecolor='w')
alignment = {'horizontalalignment': 'center', 'verticalalignment': 'baseline'}

# Show family options

families = ['serif', 'sans-serif', 'cursive', 'fantasy', 'monospace']

t = plt.text(-0.8, 0.9, 'family', size='large', **alignment)

yp = [0.8, 0.7, 0.6, 0.5, 0.4, 0.3, 0.2]

for k, family in enumerate(families):
    t = plt.text(-0.8, yp[k], family, family=family, **alignment)

# Show style options

styles = ['normal', 'italic', 'oblique']

t = plt.text(-0.4, 0.9, 'style', **alignment)

for k, style in enumerate(styles):
    t = plt.text(-0.4, yp[k], style, family='sans-serif', style=style,
                 **alignment)

# Show variant options

variants = ['normal', 'small-caps']

t = plt.text(0.0, 0.9, 'variant', **alignment)

for k, variant in enumerate(variants):
    t = plt.text(0.0, yp[k], variant, family='serif', variant=variant,
                 **alignment)

# Show weight options

weights = ['light', 'normal', 'medium', 'semibold', 'bold', 'heavy', 'black']

t = plt.text(0.4, 0.9, 'weight', **alignment)

for k, weight in enumerate(weights):
    t = plt.text(0.4, yp[k], weight, weight=weight,
                 **alignment)

# Show size options

sizes = ['xx-small', 'x-small', 'small', 'medium', 'large',
         'x-large', 'xx-large']

t = plt.text(0.8, 0.9, 'size', **alignment)

for k, size in enumerate(sizes):
    t = plt.text(0.8, yp[k], size, size=size,
                 **alignment)

x = -0.4
# Show bold italic
t = plt.text(x, 0.1, 'bold italic', style='italic',
             weight='bold', size='x-small',
             **alignment)

t = plt.text(x, 0.2, 'bold italic',
             style='italic', weight='bold', size='medium',
             **alignment)

t = plt.text(x, 0.3, 'bold italic',
             style='italic', weight='bold', size='x-large',
             **alignment)

plt.axis([-1, 1, 0, 1])

plt.show()
Keywords: matplotlib code example, codex, python plot, pyplot Gallery generated by Sphinx-Gallery