Version 2.2.2
Note
Click here to download the full example code
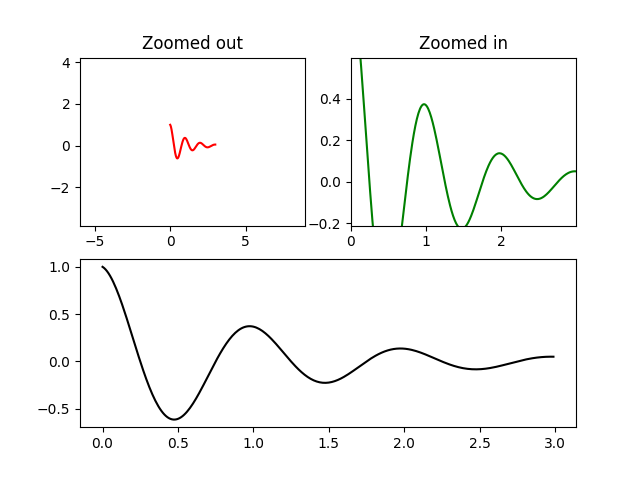
This example shows how to zoom in and out of a plot using margins
instead of set_xlim and set_ylim.
import numpy as np
import matplotlib.pyplot as plt


def f(t):
    return np.exp(-t) * np.cos(2*np.pi*t)


t1 = np.arange(0.0, 3.0, 0.01)

ax1 = plt.subplot(212)
ax1.margins(0.05)           # Default margin is 0.05, value 0 means fit
ax1.plot(t1, f(t1), 'k')

ax2 = plt.subplot(221)
ax2.margins(2, 2)           # Values >0.0 zoom out
ax2.plot(t1, f(t1), 'r')
ax2.set_title('Zoomed out')

ax3 = plt.subplot(222)
ax3.margins(x=0, y=-0.25)   # Values in (-0.5, 0.0) zooms in to center
ax3.plot(t1, f(t1), 'g')
ax3.set_title('Zoomed in')

plt.show()
Keywords: matplotlib code example, codex, python plot, pyplot Gallery generated by Sphinx-Gallery