Version 2.2.2
Note
Click here to download the full example code
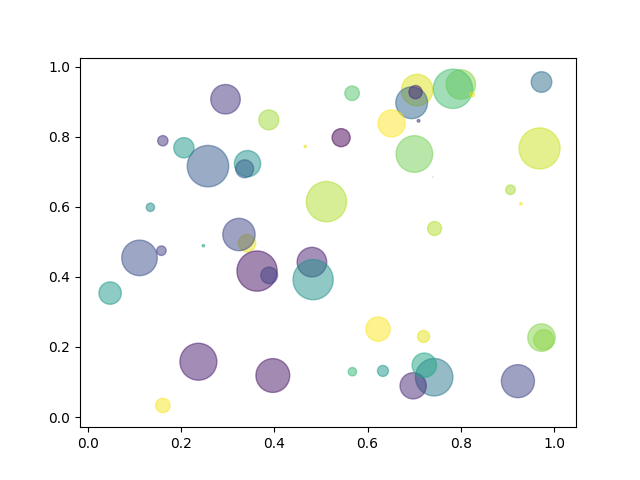
This example showcases a simple scatter plot.
import numpy as np
import matplotlib.pyplot as plt

# Fixing random state for reproducibility
np.random.seed(19680801)


N = 50
x = np.random.rand(N)
y = np.random.rand(N)
colors = np.random.rand(N)
area = (30 * np.random.rand(N))**2  # 0 to 15 point radii

plt.scatter(x, y, s=area, c=colors, alpha=0.5)
plt.show()
The use of the following functions and methods is shown in this example:
import matplotlib

matplotlib.axes.Axes.scatter
matplotlib.pyplot.scatter
Keywords: matplotlib code example, codex, python plot, pyplot Gallery generated by Sphinx-Gallery