Version 2.2.2
Note
Click here to download the full example code
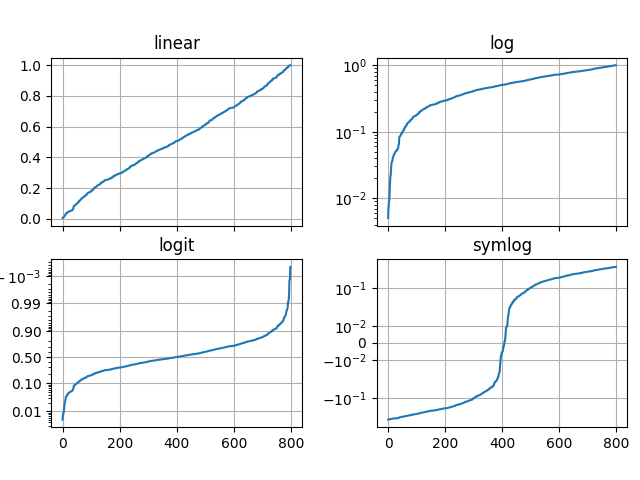
Illustrate the scale transformations applied to axes, e.g. log, symlog, logit.
import numpy as np
import matplotlib.pyplot as plt
from matplotlib.ticker import NullFormatter

# Fixing random state for reproducibility
np.random.seed(19680801)

# make up some data in the interval ]0, 1[
y = np.random.normal(loc=0.5, scale=0.4, size=1000)
y = y[(y > 0) & (y < 1)]
y.sort()
x = np.arange(len(y))

# plot with various axes scales
fig, axs = plt.subplots(2, 2, sharex=True)
fig.subplots_adjust(left=0.08, right=0.98, wspace=0.3)

# linear
ax = axs[0, 0]
ax.plot(x, y)
ax.set_yscale('linear')
ax.set_title('linear')
ax.grid(True)


# log
ax = axs[0, 1]
ax.plot(x, y)
ax.set_yscale('log')
ax.set_title('log')
ax.grid(True)


# symmetric log
ax = axs[1, 1]
ax.plot(x, y - y.mean())
ax.set_yscale('symlog', linthreshy=0.02)
ax.set_title('symlog')
ax.grid(True)

# logit
ax = axs[1, 0]
ax.plot(x, y)
ax.set_yscale('logit')
ax.set_title('logit')
ax.grid(True)
ax.yaxis.set_minor_formatter(NullFormatter())


plt.show()
Keywords: matplotlib code example, codex, python plot, pyplot Gallery generated by Sphinx-Gallery