Version 2.2.2
Note
Click here to download the full example code
import numpy as np
import matplotlib.pyplot as plt
import matplotlib.patches as patches
import matplotlib.path as path
fig = plt.figure()
ax = fig.add_subplot(111)
# Fixing random state for reproducibility
np.random.seed(19680801)
# histogram our data with numpy
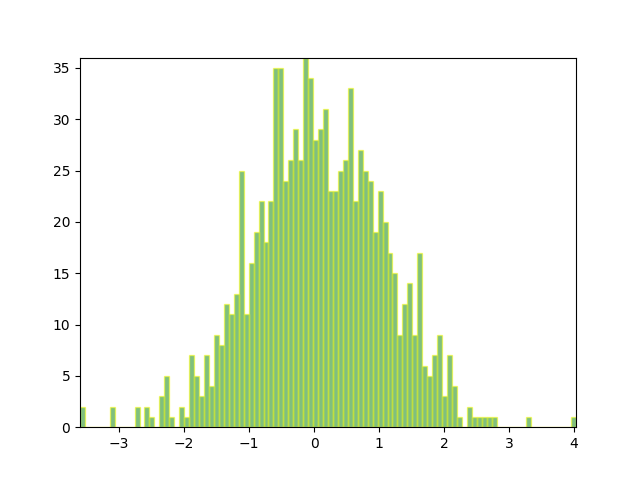
data = np.random.randn(1000)
n, bins = np.histogram(data, 100)
# get the corners of the rectangles for the histogram
left = np.array(bins[:-1])
right = np.array(bins[1:])
bottom = np.zeros(len(left))
top = bottom + n
nrects = len(left)
nverts = nrects*(1+3+1)
verts = np.zeros((nverts, 2))
codes = np.ones(nverts, int) * path.Path.LINETO
codes[0::5] = path.Path.MOVETO
codes[4::5] = path.Path.CLOSEPOLY
verts[0::5,0] = left
verts[0::5,1] = bottom
verts[1::5,0] = left
verts[1::5,1] = top
verts[2::5,0] = right
verts[2::5,1] = top
verts[3::5,0] = right
verts[3::5,1] = bottom
barpath = path.Path(verts, codes)
patch = patches.PathPatch(barpath, facecolor='green', edgecolor='yellow', alpha=0.5)
ax.add_patch(patch)
ax.set_xlim(left[0], right[-1])
ax.set_ylim(bottom.min(), top.max())
plt.show()
Keywords: matplotlib code example, codex, python plot, pyplot Gallery generated by Sphinx-Gallery