Version 2.2.2
Note
Click here to download the full example code
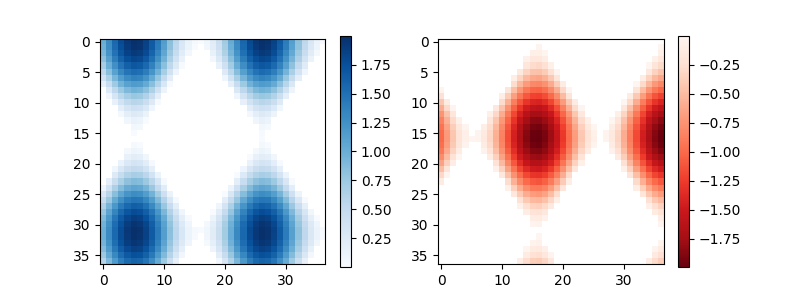
Use colorbar by specifying the mappable object (here the imshow returned object) and the axes to attach the colorbar to.
import numpy as np
import matplotlib.pyplot as plt

# setup some generic data
N = 37
x, y = np.mgrid[:N, :N]
Z = (np.cos(x*0.2) + np.sin(y*0.3))

# mask out the negative and positive values, respectively
Zpos = np.ma.masked_less(Z, 0)
Zneg = np.ma.masked_greater(Z, 0)

fig, (ax1, ax2) = plt.subplots(figsize=(8, 3), ncols=2)

# plot just the positive data and save the
# color "mappable" object returned by ax1.imshow
pos = ax1.imshow(Zpos, cmap='Blues', interpolation='none')

# add the colorbar using the figure's method,
# telling which mappable we're talking about and
# which axes object it should be near
fig.colorbar(pos, ax=ax1)

# repeat everything above for the negative data
neg = ax2.imshow(Zneg, cmap='Reds_r', interpolation='none')
fig.colorbar(neg, ax=ax2)

plt.show()
Keywords: matplotlib code example, codex, python plot, pyplot Gallery generated by Sphinx-Gallery