Version 2.2.2
Note
Click here to download the full example code
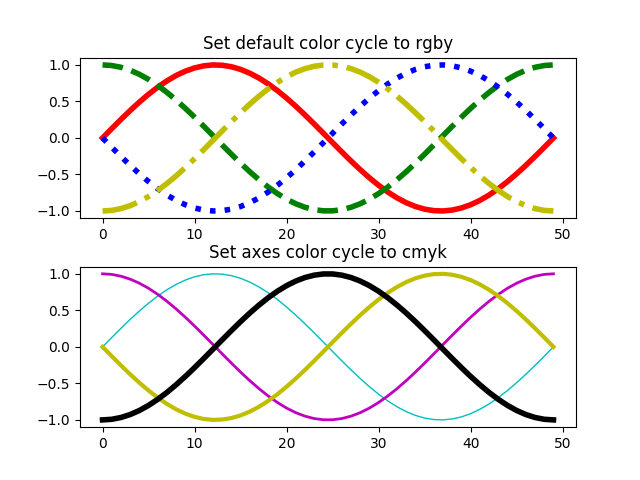
Demo of custom property-cycle settings to control colors and other style properties for multi-line plots.
This example demonstrates two different APIs:
- Setting the default rc parameter specifying the property cycle. This affects all subsequent axes (but not axes already created).
- Setting the property cycle for a single pair of axes.
from cycler import cycler
import numpy as np
import matplotlib.pyplot as plt


x = np.linspace(0, 2 * np.pi)
offsets = np.linspace(0, 2*np.pi, 4, endpoint=False)
# Create array with shifted-sine curve along each column
yy = np.transpose([np.sin(x + phi) for phi in offsets])

# 1. Setting prop cycle on default rc parameter
plt.rc('lines', linewidth=4)
plt.rc('axes', prop_cycle=(cycler('color', ['r', 'g', 'b', 'y']) +
                           cycler('linestyle', ['-', '--', ':', '-.'])))
fig, (ax0, ax1) = plt.subplots(nrows=2)
ax0.plot(yy)
ax0.set_title('Set default color cycle to rgby')

# 2. Define prop cycle for single set of axes
ax1.set_prop_cycle(cycler('color', ['c', 'm', 'y', 'k']) +
                   cycler('lw', [1, 2, 3, 4]))
ax1.plot(yy)
ax1.set_title('Set axes color cycle to cmyk')

# Tweak spacing between subplots to prevent labels from overlapping
fig.subplots_adjust(hspace=0.3)
plt.show()
Keywords: matplotlib code example, codex, python plot, pyplot Gallery generated by Sphinx-Gallery