Version 2.2.2
Note
Click here to download the full example code
import matplotlib.pyplot as plt
from mpl_toolkits.axes_grid1.inset_locator import inset_axes, zoomed_inset_axes
from mpl_toolkits.axes_grid1.anchored_artists import AnchoredSizeBar
def add_sizebar(ax, size):
asb = AnchoredSizeBar(ax.transData,
size,
str(size),
loc=8,
pad=0.1, borderpad=0.5, sep=5,
frameon=False)
ax.add_artist(asb)
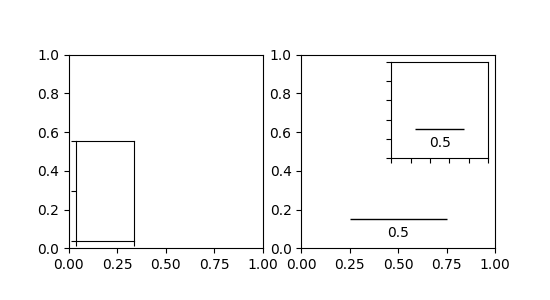
fig, (ax, ax2) = plt.subplots(1, 2, figsize=[5.5, 3])
# first subplot
ax.set_aspect(1)
axins = inset_axes(ax,
width="30%", # width = 30% of parent_bbox
height=1., # height : 1 inch
loc=3)
plt.xticks(visible=False)
plt.yticks(visible=False)
# second subplot
ax2.set_aspect(1)
axins = zoomed_inset_axes(ax2, zoom=0.5, loc='upper right')
# fix the number of ticks on the inset axes
axins.yaxis.get_major_locator().set_params(nbins=7)
axins.xaxis.get_major_locator().set_params(nbins=7)
plt.xticks(visible=False)
plt.yticks(visible=False)
add_sizebar(ax2, 0.5)
add_sizebar(axins, 0.5)
plt.draw()
plt.show()
Keywords: matplotlib code example, codex, python plot, pyplot Gallery generated by Sphinx-Gallery