Version 2.2.0
Controlling properties of text and its layout with Matplotlib.
The matplotlib.text.Text instances have a variety of
properties which can be configured via keyword arguments to the text
commands (e.g., title(),
xlabel() and text()).
| Property | Value Type |
|---|---|
| alpha | float |
| backgroundcolor | any matplotlib color |
| bbox | Rectangle prop dict plus key 'pad' which is a pad in points |
| clip_box | a matplotlib.transform.Bbox instance |
| clip_on | bool |
| clip_path | a Path instance and a Transform instance, a Patch |
| color | any matplotlib color |
| family | [ 'serif' | 'sans-serif' | 'cursive' | 'fantasy' | 'monospace' ] |
| fontproperties | a FontProperties instance |
| horizontalalignment or ha | [ 'center' | 'right' | 'left' ] |
| label | any string |
| linespacing | float |
| multialignment | ['left' | 'right' | 'center' ] |
| name or fontname | string e.g., ['Sans' | 'Courier' | 'Helvetica' …] |
| picker | [None|float|boolean|callable] |
| position | (x, y) |
| rotation | [ angle in degrees | 'vertical' | 'horizontal' ] |
| size or fontsize | [ size in points | relative size, e.g., 'smaller', 'x-large' ] |
| style or fontstyle | [ 'normal' | 'italic' | 'oblique' ] |
| text | string or anything printable with ‘%s’ conversion |
| transform | a Transform instance |
| variant | [ 'normal' | 'small-caps' ] |
| verticalalignment or va | [ 'center' | 'top' | 'bottom' | 'baseline' ] |
| visible | bool |
| weight or fontweight | [ 'normal' | 'bold' | 'heavy' | 'light' | 'ultrabold' | 'ultralight'] |
| x | float |
| y | float |
| zorder | any number |
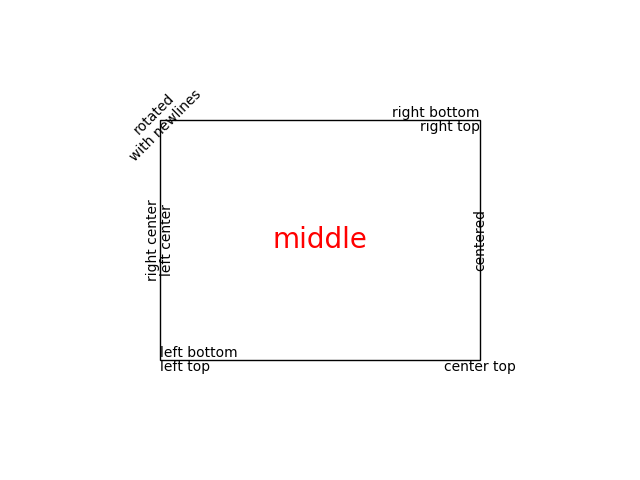
You can lay out text with the alignment arguments
horizontalalignment, verticalalignment, and
multialignment. horizontalalignment controls whether the x
positional argument for the text indicates the left, center or right
side of the text bounding box. verticalalignment controls whether
the y positional argument for the text indicates the bottom, center or
top side of the text bounding box. multialignment, for newline
separated strings only, controls whether the different lines are left,
center or right justified. Here is an example which uses the
text() command to show the various alignment
possibilities. The use of transform=ax.transAxes throughout the
code indicates that the coordinates are given relative to the axes
bounding box, with 0,0 being the lower left of the axes and 1,1 the
upper right.
import matplotlib.pyplot as plt
import matplotlib.patches as patches

# build a rectangle in axes coords
left, width = .25, .5
bottom, height = .25, .5
right = left + width
top = bottom + height

fig = plt.figure()
ax = fig.add_axes([0, 0, 1, 1])

# axes coordinates are 0,0 is bottom left and 1,1 is upper right
p = patches.Rectangle(
    (left, bottom), width, height,
    fill=False, transform=ax.transAxes, clip_on=False
    )

ax.add_patch(p)

ax.text(left, bottom, 'left top',
        horizontalalignment='left',
        verticalalignment='top',
        transform=ax.transAxes)

ax.text(left, bottom, 'left bottom',
        horizontalalignment='left',
        verticalalignment='bottom',
        transform=ax.transAxes)

ax.text(right, top, 'right bottom',
        horizontalalignment='right',
        verticalalignment='bottom',
        transform=ax.transAxes)

ax.text(right, top, 'right top',
        horizontalalignment='right',
        verticalalignment='top',
        transform=ax.transAxes)

ax.text(right, bottom, 'center top',
        horizontalalignment='center',
        verticalalignment='top',
        transform=ax.transAxes)

ax.text(left, 0.5*(bottom+top), 'right center',
        horizontalalignment='right',
        verticalalignment='center',
        rotation='vertical',
        transform=ax.transAxes)

ax.text(left, 0.5*(bottom+top), 'left center',
        horizontalalignment='left',
        verticalalignment='center',
        rotation='vertical',
        transform=ax.transAxes)

ax.text(0.5*(left+right), 0.5*(bottom+top), 'middle',
        horizontalalignment='center',
        verticalalignment='center',
        fontsize=20, color='red',
        transform=ax.transAxes)

ax.text(right, 0.5*(bottom+top), 'centered',
        horizontalalignment='center',
        verticalalignment='center',
        rotation='vertical',
        transform=ax.transAxes)

ax.text(left, top, 'rotated\nwith newlines',
        horizontalalignment='center',
        verticalalignment='center',
        rotation=45,
        transform=ax.transAxes)

ax.set_axis_off()
plt.show()
The base default font is controlled by a set of rcParams. To set the font
for mathematical expressions, use the rcParams beginning with mathtext
(see mathtext).
| rcParam | usage |
|---|---|
'font.family' |
List of either names of font or {'cursive',
'fantasy', 'monospace', 'sans', 'sans serif',
'sans-serif', 'serif'}. |
'font.style' |
The default style, ex 'normal',
'italic'. |
'font.variant' |
Default variant, ex 'normal', 'small-caps'
(untested) |
'font.stretch' |
Default stretch, ex 'normal', 'condensed'
(incomplete) |
'font.weight' |
Default weight. Either string or integer |
'font.size' |
Default font size in points. Relative font sizes
('large', 'x-small') are computed against
this size. |
The mapping between the family aliases ({'cursive', 'fantasy',
'monospace', 'sans', 'sans serif', 'sans-serif', 'serif'}) and actual font names
is controlled by the following rcParams:
| family alias | rcParam with mappings |
|---|---|
'serif' |
'font.serif' |
'monospace' |
'font.monospace' |
'fantasy' |
'font.fantasy' |
'cursive' |
'font.cursive' |
{'sans', 'sans serif', 'sans-serif'} |
'font.sans-serif' |
which are lists of font names.
As of v2.0 the default font contains glyphs for many western alphabets, but still does not cover all of the glyphs that may be required by mpl users. For example, DejaVu has no coverage of Chinese, Korean, or Japanese.
To set the default font to be one that supports the code points you
need, prepend the font name to 'font.family' or the desired alias
lists
matplotlib.rcParams['font.sans-serif'] = ['Source Han Sans TW', 'sans-serif']
or set it in your .matplotlibrc file:
font.sans-serif: Source Han Sans TW, Arial, sans-serif
To control the font used on per-artist basis use the 'name',
'fontname' or 'fontproperties' kwargs documented above.
On linux, fc-list can be a useful tool to discover the font name; for example
$ fc-list :lang=zh family
Noto to Sans Mono CJK TC,Noto Sans Mono CJK TC Bold
Noto Sans CJK TC,Noto Sans CJK TC Medium
Noto Sans CJK TC,Noto Sans CJK TC DemiLight
Noto Sans CJK KR,Noto Sans CJK KR Black
Noto Sans CJK TC,Noto Sans CJK TC Black
Noto Sans Mono CJK TC,Noto Sans Mono CJK TC Regular
Noto Sans CJK SC,Noto Sans CJK SC Light
lists all of the fonts that support Chinese.