Version 2.2.0
import matplotlib.pyplot as plt
import matplotlib.patches as mpatches
fig, axs = plt.subplots(3, 5, figsize=(8, 4.8))
x1, y1 = 0.3, 0.3
x2, y2 = 0.7, 0.7
def demo_con_style(ax, connectionstyle, label=None):
x1, y1 = 0.3, 0.2
x2, y2 = 0.8, 0.6
ax.plot([x1, x2], [y1, y2], ".")
ax.annotate("",
xy=(x1, y1), xycoords='data',
xytext=(x2, y2), textcoords='data',
arrowprops=dict(arrowstyle="->",
color="0.5",
shrinkA=5, shrinkB=5,
patchA=None,
patchB=None,
connectionstyle=connectionstyle,
),
)
ax.text(.05, .95, connectionstyle.replace(",", ",\n"),
transform=ax.transAxes, ha="left", va="top")
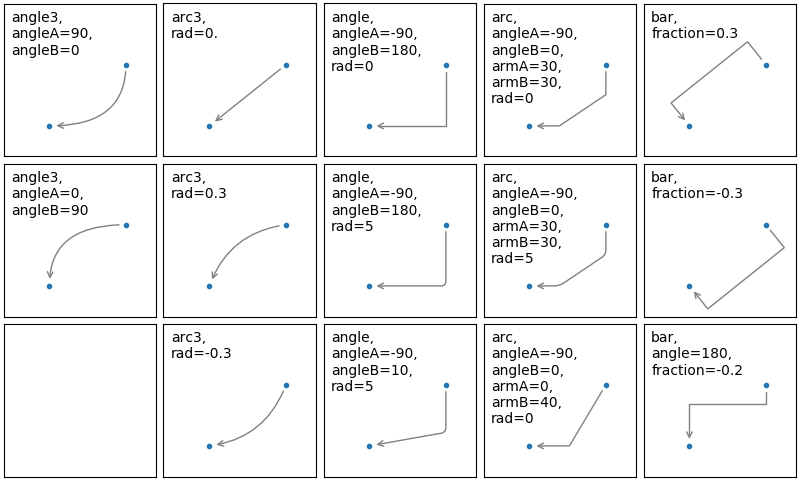
demo_con_style(axs[0, 0], "angle3,angleA=90,angleB=0")
demo_con_style(axs[1, 0], "angle3,angleA=0,angleB=90")
demo_con_style(axs[0, 1], "arc3,rad=0.")
demo_con_style(axs[1, 1], "arc3,rad=0.3")
demo_con_style(axs[2, 1], "arc3,rad=-0.3")
demo_con_style(axs[0, 2], "angle,angleA=-90,angleB=180,rad=0")
demo_con_style(axs[1, 2], "angle,angleA=-90,angleB=180,rad=5")
demo_con_style(axs[2, 2], "angle,angleA=-90,angleB=10,rad=5")
demo_con_style(axs[0, 3], "arc,angleA=-90,angleB=0,armA=30,armB=30,rad=0")
demo_con_style(axs[1, 3], "arc,angleA=-90,angleB=0,armA=30,armB=30,rad=5")
demo_con_style(axs[2, 3], "arc,angleA=-90,angleB=0,armA=0,armB=40,rad=0")
demo_con_style(axs[0, 4], "bar,fraction=0.3")
demo_con_style(axs[1, 4], "bar,fraction=-0.3")
demo_con_style(axs[2, 4], "bar,angle=180,fraction=-0.2")
for ax in axs.flat:
ax.set(xlim=(0, 1), ylim=(0, 1), xticks=[], yticks=[], aspect=1)
fig.tight_layout(pad=0)
plt.show()