Version 2.2.0
Plotting legends in Matplotlib.
There are many ways to create and customize legends in Matplotlib. Below we’ll show a few examples for how to do so.
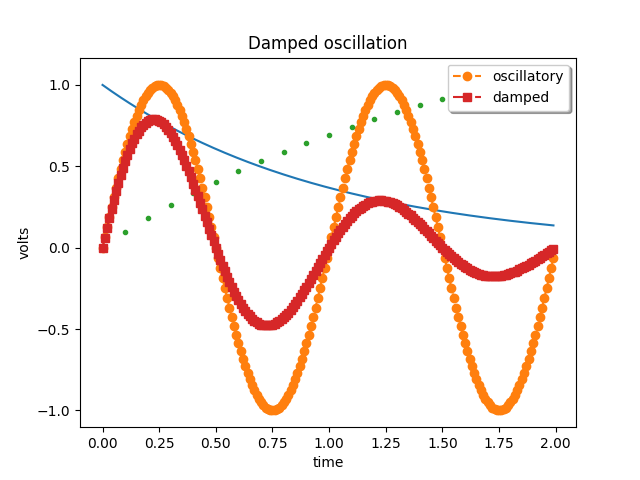
First we’ll show off how to make a legend for specific lines.
from __future__ import (absolute_import, division,
                        print_function, unicode_literals)

import matplotlib.pyplot as plt
import numpy as np
from matplotlib.legend_handler import (HandlerLineCollection,
                                       HandlerTuple)
import matplotlib.collections as mcol
from matplotlib.lines import Line2D

t1 = np.arange(0.0, 2.0, 0.1)
t2 = np.arange(0.0, 2.0, 0.01)

fig, ax = plt.subplots()

# note that plot returns a list of lines.  The "l1, = plot" usage
# extracts the first element of the list into l1 using tuple
# unpacking.  So l1 is a Line2D instance, not a sequence of lines
l1, = ax.plot(t2, np.exp(-t2))
l2, l3 = ax.plot(t2, np.sin(2 * np.pi * t2), '--o', t1, np.log(1 + t1), '.')
l4, = ax.plot(t2, np.exp(-t2) * np.sin(2 * np.pi * t2), 's-.')

ax.legend((l2, l4), ('oscillatory', 'damped'), loc='upper right', shadow=True)
ax.set_xlabel('time')
ax.set_ylabel('volts')
ax.set_title('Damped oscillation')
plt.show()
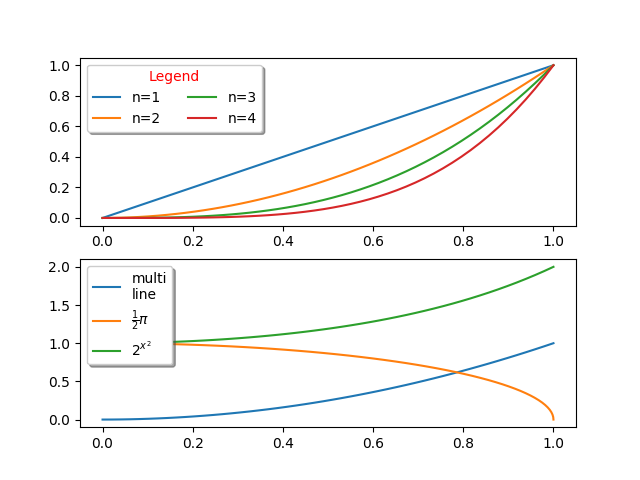
Next we’ll demonstrate plotting more complex labels.
x = np.linspace(0, 1)

fig, (ax0, ax1) = plt.subplots(2, 1)

# Plot the lines y=x**n for n=1..4.
for n in range(1, 5):
    ax0.plot(x, x**n, label="n={0}".format(n))
leg = ax0.legend(loc="upper left", bbox_to_anchor=[0, 1],
                 ncol=2, shadow=True, title="Legend", fancybox=True)
leg.get_title().set_color("red")

# Demonstrate some more complex labels.
ax1.plot(x, x**2, label="multi\nline")
half_pi = np.linspace(0, np.pi / 2)
ax1.plot(np.sin(half_pi), np.cos(half_pi), label=r"$\frac{1}{2}\pi$")
ax1.plot(x, 2**(x**2), label="$2^{x^2}$")
ax1.legend(shadow=True, fancybox=True)

plt.show()
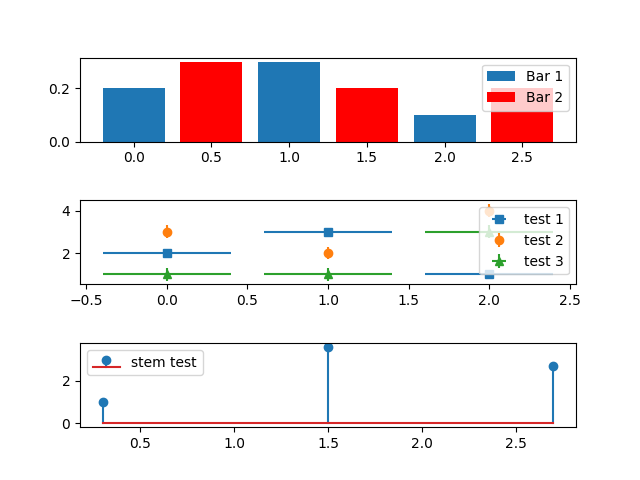
Here we attach legends to more complex plots.
fig, axes = plt.subplots(3, 1)
top_ax, middle_ax, bottom_ax = axes

top_ax.bar([0, 1, 2], [0.2, 0.3, 0.1], width=0.4, label="Bar 1",
           align="center")
top_ax.bar([0.5, 1.5, 2.5], [0.3, 0.2, 0.2], color="red", width=0.4,
           label="Bar 2", align="center")
top_ax.legend()

middle_ax.errorbar([0, 1, 2], [2, 3, 1], xerr=0.4, fmt="s", label="test 1")
middle_ax.errorbar([0, 1, 2], [3, 2, 4], yerr=0.3, fmt="o", label="test 2")
middle_ax.errorbar([0, 1, 2], [1, 1, 3], xerr=0.4, yerr=0.3, fmt="^",
                   label="test 3")
middle_ax.legend()

bottom_ax.stem([0.3, 1.5, 2.7], [1, 3.6, 2.7], label="stem test")
bottom_ax.legend()

plt.subplots_adjust(hspace=0.7)
plt.show()
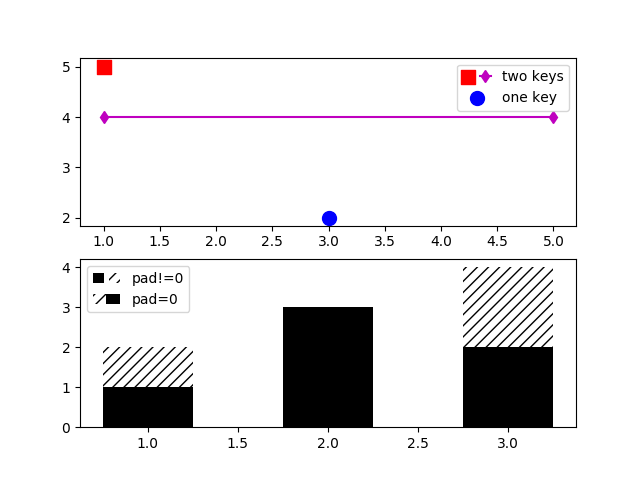
Now we’ll showcase legend entries with more than one legend key.
fig, (ax1, ax2) = plt.subplots(2, 1)

# First plot: two legend keys for a single entry
p1 = ax1.scatter([1], [5], c='r', marker='s', s=100)
p2 = ax1.scatter([3], [2], c='b', marker='o', s=100)
# `plot` returns a list, but we want the handle - thus the comma on the left
p3, = ax1.plot([1, 5], [4, 4], 'm-d')

# Assign two of the handles to the same legend entry by putting them in a tuple
# and using a generic handler map (which would be used for any additional
# tuples of handles like (p1, p3)).
l = ax1.legend([(p1, p3), p2], ['two keys', 'one key'], scatterpoints=1,
               numpoints=1, handler_map={tuple: HandlerTuple(ndivide=None)})

# Second plot: plot two bar charts on top of each other and change the padding
# between the legend keys
x_left = [1, 2, 3]
y_pos = [1, 3, 2]
y_neg = [2, 1, 4]

rneg = ax2.bar(x_left, y_neg, width=0.5, color='w', hatch='///', label='-1')
rpos = ax2.bar(x_left, y_pos, width=0.5, color='k', label='+1')

# Treat each legend entry differently by using specific `HandlerTuple`s
l = ax2.legend([(rpos, rneg), (rneg, rpos)], ['pad!=0', 'pad=0'],
               handler_map={(rpos, rneg): HandlerTuple(ndivide=None),
                            (rneg, rpos): HandlerTuple(ndivide=None, pad=0.)})

plt.show()
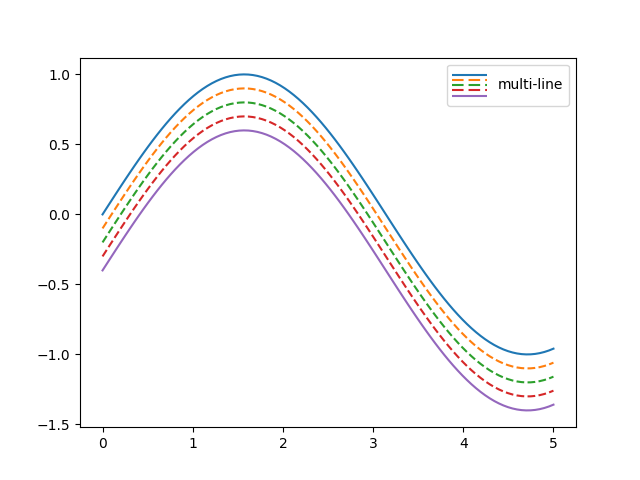
Finally, it is also possible to write custom objects that define how to stylize legends.
class HandlerDashedLines(HandlerLineCollection):
    """
    Custom Handler for LineCollection instances.
    """
    def create_artists(self, legend, orig_handle,
                       xdescent, ydescent, width, height, fontsize, trans):
        # figure out how many lines there are
        numlines = len(orig_handle.get_segments())
        xdata, xdata_marker = self.get_xdata(legend, xdescent, ydescent,
                                             width, height, fontsize)
        leglines = []
        # divide the vertical space where the lines will go
        # into equal parts based on the number of lines
        ydata = ((height) / (numlines + 1)) * np.ones(xdata.shape, float)
        # for each line, create the line at the proper location
        # and set the dash pattern
        for i in range(numlines):
            legline = Line2D(xdata, ydata * (numlines - i) - ydescent)
            self.update_prop(legline, orig_handle, legend)
            # set color, dash pattern, and linewidth to that
            # of the lines in linecollection
            try:
                color = orig_handle.get_colors()[i]
            except IndexError:
                color = orig_handle.get_colors()[0]
            try:
                dashes = orig_handle.get_dashes()[i]
            except IndexError:
                dashes = orig_handle.get_dashes()[0]
            try:
                lw = orig_handle.get_linewidths()[i]
            except IndexError:
                lw = orig_handle.get_linewidths()[0]
            if dashes[0] is not None:
                legline.set_dashes(dashes[1])
            legline.set_color(color)
            legline.set_transform(trans)
            legline.set_linewidth(lw)
            leglines.append(legline)
        return leglines

x = np.linspace(0, 5, 100)

fig, ax = plt.subplots()
colors = plt.rcParams['axes.prop_cycle'].by_key()['color'][:5]
styles = ['solid', 'dashed', 'dashed', 'dashed', 'solid']
lines = []
for i, color, style in zip(range(5), colors, styles):
    ax.plot(x, np.sin(x) - .1 * i, c=color, ls=style)


# make proxy artists
# make list of one line -- doesn't matter what the coordinates are
line = [[(0, 0)]]
# set up the proxy artist
lc = mcol.LineCollection(5 * line, linestyles=styles, colors=colors)
# create the legend
ax.legend([lc], ['multi-line'], handler_map={type(lc): HandlerDashedLines()},
          handlelength=2.5, handleheight=3)

plt.show()