Version 2.2.0
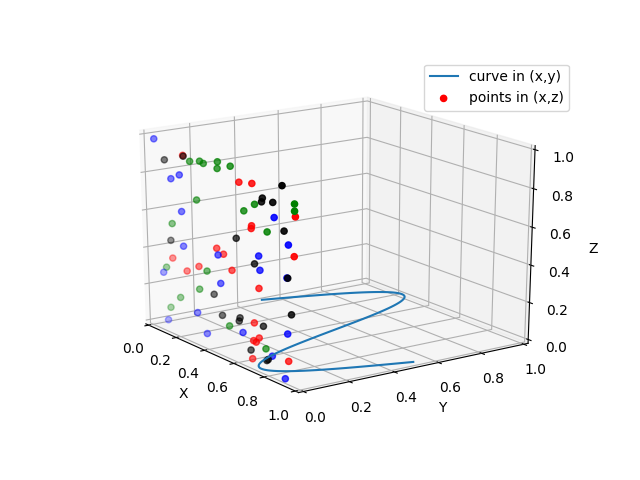
Demonstrates using ax.plot’s zdir keyword to plot 2D data on selective axes of a 3D plot.
from mpl_toolkits.mplot3d import Axes3D
import numpy as np
import matplotlib.pyplot as plt

fig = plt.figure()
ax = fig.gca(projection='3d')

# Plot a sin curve using the x and y axes.
x = np.linspace(0, 1, 100)
y = np.sin(x * 2 * np.pi) / 2 + 0.5
ax.plot(x, y, zs=0, zdir='z', label='curve in (x,y)')

# Plot scatterplot data (20 2D points per colour) on the x and z axes.
colors = ('r', 'g', 'b', 'k')

# Fixing random state for reproducibility
np.random.seed(19680801)

x = np.random.sample(20 * len(colors))
y = np.random.sample(20 * len(colors))
c_list = []
for c in colors:
    c_list.extend([c] * 20)
# By using zdir='y', the y value of these points is fixed to the zs value 0
# and the (x,y) points are plotted on the x and z axes.
ax.scatter(x, y, zs=0, zdir='y', c=c_list, label='points in (x,z)')

# Make legend, set axes limits and labels
ax.legend()
ax.set_xlim(0, 1)
ax.set_ylim(0, 1)
ax.set_zlim(0, 1)
ax.set_xlabel('X')
ax.set_ylabel('Y')
ax.set_zlabel('Z')

# Customize the view angle so it's easier to see that the scatter points lie
# on the plane y=0
ax.view_init(elev=20., azim=-35)

plt.show()